

Introduction to Technical Analysis

What Is Technical Analysis
Mathematics… statistics… who does not switch off when these two are involved! Yet, they are a big aspect of the financial markets. Mathematic and statistical techniques are fast taking over. Technical analysis is used by a great number of experts. All this sounds extremely complicated. An investor can easily feel it is beyond their understanding.
However, the fundamentals of technical analysis are fairly easy if explained right. Once you know that, you can easily understand how to do technical analysis of stocks. And that is what we are going to do this section—explain the importance of technical analysis and learn technical analysis of stocks using these fundamentals. But first, let’s hit the basics.
What Is Technical Analysis
Technical analysis is the study of chart patterns and statistical figures to understand market trends and pick stocks accordingly. Sounds complicated? Here is a simpler definition.
One day the share price is up, another day it may be down. But over time, if you look at the stock price’s movement, you may see trends and patterns emerge. The study of these chart patterns and trends in stock prices is called technical analysis of stocks. When you learn technical analysis of stocks, you will understand the big role that technical indicators play.
First before we learn how to do technical analysis of stocks, let us understand some of its broad features:
- History Repeats:
Technical analysts believe that historical price trends tend to repeat over time. So, they sit with historical stock charts, look at price and volume information and then using trends, they try to figure out how the stock’s price may move in the future. Accordingly, they pick stocks that they feel will appreciate and sell the ones they feel will depreciate.
How Does Technical Analysis Work?
The fundamental principle behind technical analysis is that market behaviour patterns tend to repeat over time. Price charts are the primary tool used in the technical analysis of stocks, as they visually represent the historical price movements of a security, making it easier to identify trends and patterns. Identifying trends is a crucial part of technical analysis of the financial markets, whether they are upward (bullish), downward (bearish), or sideways (neutral), as recognising these trends helps traders align their strategies accordingly. Additionally, technical analysis of stock trends often involves identifying various chart patterns, such as head and shoulders, double tops and bottoms, and triangles, which can provide insights into potential price movements.
Technical Analysis V/S Fundamental Analysis:
The technical-analysis approach to the study of stock charts is the opposite of the fundamental approach. If you were a fundamental analyst, you would study a company’s financial statements, such as the income statement and the balance sheet, to ascertain its growth potential. You would also try to monitor factors outside these financial statements that would increase the company’s earnings in the future. For example, you would keep track of the new businesses the company is investing in, the new markets it is entering, and the new technology it has adopted, and so on.
Technical analysis doesn’t believe in this approach. It believes that stock prices move in circles. If you can spot the section of the circle the price is currently in, you will be able to make sound investment decisions. To identify the current stage of the price pattern, you would use some analytical tools. These include various types of stock charts, some momentum indicators and moving averages. We will get into these in detail in further sections.
The Difference Between Technical Analysis And Fundamental Analysis
The following is the key comparison table between technical analysis and fundamental analysis:
| Basis | Fundamental Analysis | Technical Analysis |
|---|---|---|
Meaning | The practice of analysing securities by determining the intrinsic stock value. | A method of determining the future stock price by using charts. |
Relevant for | Long term investment | Short term investment |
Function | Investing | Trading |
Objective | To identify the intrinsic stock value | To identify the optimal time to enter or exit the market |
Decision-based on | Available information and statistical evaluation. | Market trends and stock price |
Focuses on | Past and present data | Only past data |
Form of data | News, events, industry statistics and economic reports. | Chart Analysis |
Future prices | Determined based on past and present performance and the company’s profitability. | Determined based on indicators and charts. |
Type of trader | Long-term position trader | Short-term day trader and swing trader |
Fundamental Of Technical Analysis:
In order to use technical analysis for predicting stock prices, we have to assume that there is some relationship between historical chart patterns and future stock prices. This is the only way we can meaningfully use historical data to predict future prices. There are three fundamental assumptions in the technical analysis of stocks.
- Market Prices Reflect All The Information About A Stock:
Earlier, we said that fundamental analysis concerns itself with financial and other information about a stock. Technical analysis of stocks, though completely detached from fundamental analysis, works on a similar premise.
If you are a technical analyst, you believe that all investors are aware of everything there is to know about a stock. They actually use this information when making buy/sell decisions. This information subsequently gets reflected in the stock’s price and ultimately the stock chart. This is why they only study chart patterns to gauge market trends, and not concern themselves with fundamental factors.
- Patterns Tend To Repeat Themselves:
The last assumption that validates a technical analysis is that trends are repetitive. In other words, suppose a stock chart moves in a hypothetical pattern- A-B-C. So, each time we reach ‘C’, we will again start from ‘A’, and then go to ‘B’ and eventually ‘C’. This pattern will repeat itself without fail.
Only once you make this assumption can you predict future stock prices based on technical analysis. Without this assumption, there is no way to tell where the price will go next by simply looking at a chart.
- Stock Prices Follow Trends:
Technical analysis of stocks is based on the idea that each stock chart has its own unique trend. Prices move only within this trend. Every move in the stock price will indicate the next move. Let’s take the hypothetical example of a ripple.
When you throw a stone in a pond, you know that consecutive ripples will get formed as soon as the stone hits the water. After a few ripples, the trend will die out. However, the next time you throw a stone, a similar ripple will appear again.
Similarly, even for stock charts, you know the trend from past experiences. Naturally, the move in either direction may be larger or smaller than before, just like ripples. If you throw a larger or a smaller stone, ripples too will be larger or smaller respectively. However, the pattern of these ripples will not change dramatically.
Based on these assumptions, you can use three important technical indicators to identify market trends and predict future stock prices.
- Charts:
Price and volume charts are the most typical tools that are used as technical indicators for technical analysis. A volume chart depicts the number of shares of a company that were bought and sold in the market during a day.
For the purpose of technical analysis, you may choose one of the traditional line or bar charts, or alternatively, use a candlestick chart. A candlestick chart is a special kind of chart that is particularly relevant for technical analysis. It is in the form of a series of consecutive candles. We will discuss candlestick charts in detail in the section on stock charts. Charts are used together with trendlines.
Trendlines indicate the direction of movement of a stock over a period of time.
- Momentum Indicators:
Momentum indicators are statistical figures that are calculated based on price and volume data of stocks. These technical indicators act as supporting tools to charts and moving averages.
Once you are through with forming an opinion about a stock based on the other tools we have discussed, you can use these indicators to confirm your views. Some momentum indicators are signs that occur before the price move you expected occurs. They confirm that the price is indeed going to move as you thought it would.
These are called leading indicators. Other signs come after the stock has started moving in a particular direction. They are called lagging indicators. They confirm that the stock will continue moving in this direction. Indicators are also used together with moving averages.
For example, when a stock price moves in such a way that it starts falling within a moving average, it is a confirmatory sign that it will continue to move as expected. This is called a crossover. Other popular momentum indicators include moving average convergence divergence (MACD), accumulation/distribution line and Aroon. We will discuss some of these in subsequent sections.
- Moving Averages:
Moving averages are calculated to remove sharp, frequent fluctuations in a stock chart. Sometimes, stock prices can move very sharply in a small period of time.
This makes it hard to discover a trend in the stock chart. To remove the impact of this, and make a trend more prominent, an average of a few days price is calculated. For example, if a five-day pattern of a stock’s price is Rs.50, 53, 47, 45 and 52, it is difficult to tell the direction in which prices have actually moved. However, if you can calculate the average of these prices and compare them with the average of the next five days and the previous five days, you can ascertain a broad trend.
This kind of moving average is called simple moving average (SMA). Other commonly used moving average concepts are exponential moving average (EMA) and linear weighted average (LWA). It may be noted though, that moving averages are calculated for longer durations than five days. Ten days and one month moving averages are more common.
Importance Of Technical Analysis
Technical analysis is gaining popularity worldwide. Here are some of the reasons why it is so important to the analysis of financial markets:
- Mathematical Approach:
Technical analysts use probability to pick stocks. By using probability, they are able to predict the outcome of an action without necessarily needing to scrutinize it in great detail.
So, technical analysis tells you how prices are going to move without requiring you to bother about the nitty-gritties that will cause the price to move. It is much quicker and less laborious than fundamental analysis.
- Signs Of Upcoming Danger:
Sometimes, a major fall in stock prices is just around the corner but nobody can see it coming. Fundamental analysis tools are unable to predict it. However, by using historical chart patterns and other technical tools, one can predict the fall.
Now naturally, technical analysis cannot tell you the reason for the fall, but it can tell you that it is about to come. You can prepare yourself for it accordingly.
For example, before the 2009 financial crisis, everything was going well in the US stock markets. Nobody could say that stocks will fall so soon and so sharply. However, technical analysts predicted beforehand that markets are about to enter one of the biggest falls ever.
- Identification Of Short-Term Trends:
Fundamental analysis is more relevant for investors who want to invest for a long period of say three to five years or more. This is because any profitable business model takes time to be successful.
So, investors too have to remain patient. This is not so with technical analysis. Eventually, the success of a stock depends on the company’s profitability. This cannot be predicted by technical analysis. It can only tell you whether the stock is going to move up or down in the near future.
For example, if a company acquires a new plant and starts producing more output from it, its revenues will go up. This should lead to an increase in its stock price. But how can you predict such a change by simply studying past charts and trends? In the short run, however, fundamental factors can only have a small effect on prices. For example, the plant we just talked about cannot start producing overnight. It will take time. In such cases, technical analysis presents a clearer picture. Thus, technical analysis is more relevant if you want to make a quick buck in say three to six months, or even three.
Use of Technical Analysis
The following are the uses of technical analysis:
-
Professional analysts combine technical analysis with other forms of research.
-
Retail traders typically make decisions based solely on price charts and related data. However, experts who analyse stocks usually don't depend solely on technical or fundamental analysis.
-
You can apply technical analysis to any asset with a trading data history.
-
Technical analysis can be used for various assets, including commodities, currencies, stocks, and other securities.
-
The commodity and foreign exchange (FX) markets frequently utilise technical analysis because they focus on predicting short-term price movements.
Technical Analysis Of Stocks
How To Read Stock Charts (Content And Graphics)
Technical analysis is mainly about interpreting stock price movement and trade volumes. However, interpreting and analysing it is not quite simple. It needs to be converted into a format that is easy to understand. Stock charts are a great way of presenting this data. Below are some chart patterns that will help you understand stock charts better.
- Reversal Patterns
Reversal patterns indicate that the present price movement trend could reverse. In other words, if the price of a stock is currently increasing, it will start falling and if it is decreasing, it will start rising.
There are two prominent reversal patterns:
- Head and shoulders pattern
The head and shoulders pattern is created when three consecutive waves appear on a stock price chart. A head and shoulders pattern normally forms after a strong upward pattern. The peak of the first (left) shoulder is higher than that of the rally that preceded it. It is marked by very high market volumes. The fall that follows this is sharp and takes the price close to the point from where the shoulder began. It is marked by low volumes.
-
Inverse Head And Shoulders Pattern
A head and shoulder pattern marks the reversal of an uptrend. However, being a reversal pattern, it should also mark the reversal of a downtrend, i.e. the end of a period of constantly falling prices. Such a reversal is indicated by the head and shoulders pattern when it is formed in an upside-down fashion.
-
Double Tops Pattern
A double top occurs after a significant uptrend. It contains two waves instead of three. Unlike head and shoulders, the price at both peaks is the same. The larger the duration and the fall between the two waves, the larger will be the fall when the trend eventually reverses. The formula for calculating the target price in the case of double tops is the same as the one for the head and shoulders pattern.
-
Double Bottom Pattern
A double bottom pattern follows a spell of constantly falling prices and looks like a water image of the double top pattern.
-
Contiunation Patterns
Continuation patterns offer confirmation that the trend that was reflected by a stock chart before the emergence of the pattern will continue in the future. For example, if the price was heading higher, it will continue to do so. Similarly, if it was heading lower, it will continue to do so.
There are three common continuation patterns:
-
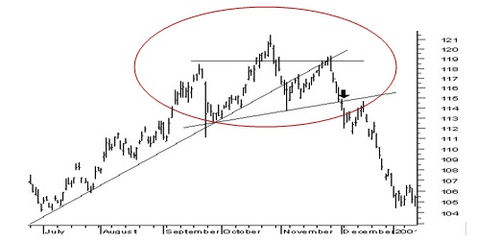
Triangle pattern
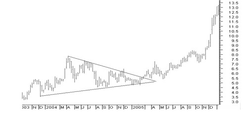
When the difference between the tops and bottoms on a stock chart is constantly reducing, it forms a triangle pattern. As a result, if trend lines are inserted for tops and bottoms respectively, they will converge. This will give the pattern the appearance of a triangle. The difference between tops and bottoms reduces because of one of the three reasons listed below.
Bottoms are increasing while the tops are constant
Tops are falling while the bottoms are constant
Both tops and bottoms are converging
These patterns lead to ascending, descending, and symmetrical triangles respectively.
-
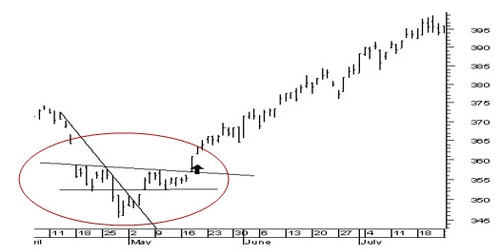
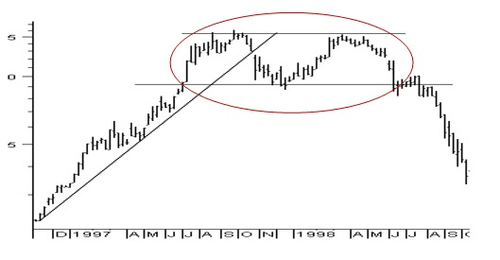
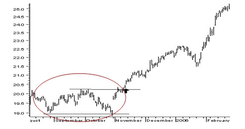
Rectangle Pattern
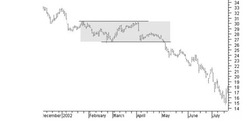
A rectangular pattern is formed when a stock’s price has been moving within a range. Every up-move ends at the same top and every down-move ends at the same bottom. In other words, there is no change in the top and bottom prices for a long period.
Limitations Of Technical Analysis
Technical analysis, just like any other trading strategy, has limitations. Looking at charts can sometimes be confusing, and patterns might form because not many trades are happening.
Also, the periods used to calculate averages might not fit the type of trade you want to do. But apart from these issues, something is interesting about analysing stocks and trends this way.
When many traders start using the same technical analysis methods and tools, it can impact the prices of things like stocks. Simply, how people analyse things can change how those things are priced.
Hypothetical Investments
An important factor in technical analysis is identifying hypothetical investment trends with the help of Online Investment Simulators. For example, if someone invested $1,000 in Tesla INC stocks 5 years ago, the investment would be worth $8,156 today.
What Is the Best Technical Indicator?
The technical analysis definition encompasses the study of price charts and trading volumes to identify patterns that can suggest future movements. By doing so, traders and investors can make informed decisions about buying or selling securities. Traders often rely on various indicators to assist their market analysis. While there are numerous indicators available, some stand out due to their reliability and widespread use. Here are a few popular ones:
-
Moving Averages (MA): This indicator smooths out price data to create a single flowing line, making it easier to identify trends over a specific period. The two most common types are the Simple Moving Average (SMA) and the Exponential Moving Average (EMA).
-
Relative Strength Index (RSI): The RSI measures the speed and change of price movements, indicating overbought or oversold conditions in the market. It ranges from 0 to 100, with levels above 70 suggesting overbought conditions and levels below 30 indicating oversold conditions.
-
Moving Average Convergence Divergence (MACD): The MACD is a trend-following momentum indicator that shows the relationship between two moving averages of a security's price. It helps traders identify potential buy and sell signals.
-
Bollinger Bands: These bands consist of a middle band (usually a 20-day SMA) and two outer bands that are standard deviations away from the middle band. They help identify periods of high and low volatility and potential overbought or oversold conditions. Each of these indicators has its strengths and can be used alone or in combination with others to enhance the accuracy of trading technical analysis.
What Does Technical Analysis Look for?
Technical analysis seeks to identify several key factors that can influence trading decisions. Momentum involves measuring the speed of price movements, and indicators like the RSI and MACD are pivotal in this aspect. These tools help determine the momentum of a security, indicating whether it's gaining or losing strength. Analysing trading volumes is another critical component in the technical analysis of stocks.
Volatility measures the extent of price fluctuations, and tools like Bollinger Bands are essential in identifying periods of high and low volatility. This aids traders in managing risk effectively. By understanding these factors, one can leverage share market technical analysis to gain a comprehensive view of market conditions. Combining these elements provides a robust framework for making trading decisions based on technical analysis.
The Bottom Line
Understanding the technical analysis meaning and its practical application can significantly enhance your trading and investing strategies. Whether you're new to the market or an experienced trader, incorporating technical analysis into your toolkit can help you navigate the complexities of the financial markets more effectively.
FAQs on Stock Market Technical Analysis
The 4 basics of technical analysis are spotting patterns, extending these patterns, distinguishing the real pattern from random changes, and making important trading choices based on charts.
Studying stock charts involves a few key steps. Start by looking at the price movements over a certain period, like a day, week, or month. Identify patterns or trends in the chart, such as upward or downward movements. Pay attention to important indicators like moving averages or volume and use them to make informed decisions about buying or selling stocks.
Pros and cons of technical analysis:
Pros: Technical analysis helps identify trends and patterns quickly, aiding in timely trading decisions. It's suitable for short-term trading and works well in volatile markets. Visual tools make it accessible.
Cons: Technical analysis might overlook fundamental factors impacting a security's value. It's less effective for long-term investments and can be subjective, leading to different interpretations. Relying solely on historical data might not predict unforeseen events accurately.
Technical analysis operates on three fundamental principles and assumptions:
- All information is already reflected in the market.
- Prices follow both trends and countertrends.
- Price behaviour repeats itself, showing familiar patterns over time.
Technical market analysis helps you guess what might happen in the market, like if prices will go up, down, or stay the same. This can help you make smart decisions about when to buy or sell so you can make money. Also, by doing this analysis, you can get an idea about trader’s psychology.
Momentum indicators. These indicators are statistical figures that are calculated based on the price and volume data of stocks.
Technical analysis refers to the process of forecasting the future performance of a stock by analysing the company’s historical market data.
Market prices reflect all the information about a stock
Stock prices follow trends
Patterns tend to repeat themselves
Moving Average Convergence Divergence (MACD)
While they could be complicated to understand, the fundamentals of technical analysis are fairly easy if explained right.
Popular Stocks
| Stock Name | Market Price | ||||||||
|---|---|---|---|---|---|---|---|---|---|
- | |||||||||
- | |||||||||
- | |||||||||
- | |||||||||
- | |||||||||
- | |||||||||
- | |||||||||
- | |||||||||
- | |||||||||
- | |||||||||


