

Understanding Double Top And Bottom Patterns
- 4m•
- 2,089•
- 01 Sep 2023
What is a Double Top Pattern?
An asset develops a double top, a very negative technical reversal pattern, when it experiences two consecutive high prices with only a slight price decline in between. When the asset's price crosses a resistance level that corresponds to the space between the two prior highs, it is said to be conclusive.
What is a Double Bottom Pattern?
The double bottom pattern is a bullish reversal pattern that appears at the bottom of a downtrend and alerts traders of the sellers' momentum loss. The sellers had been in control of the price movement up until this point. The two-touched low and a switch from a downward to an upward trend give the pattern a "W" shape.
Double top and bottom patterns are formed from consecutive rounding tops and bottoms. These patterns are often used in conjunction with other indicators in technical charting.
A double top pattern is formed from two consecutive rounding tops. The first rounding top forms an upside-down ‘U’ pattern. Rounding tops can often be an indicator for a bearish reversal, as they often occur after an extended bullish rally. If a double top occurs, the second rounded top will usually be slightly below the first rounded tops peak indicating resistance and exhaustion. Their formation suggests that investors are seeking to obtain final profits from a longer bullish trend.
Double bottom patterns, on the other hand, are essentially the opposite of double top patterns. A double bottom is formed following a single rounding bottom pattern which can also be the first sign of a potential reversal. Rounding bottom patterns will typically occur at the end of an extended bearish trend. After a double bottom, common trading strategies include long positions that will profit from a rising security price.
Here are three stocks that formed a double top and double bottom pattern on the technical charts in the past few weeks:
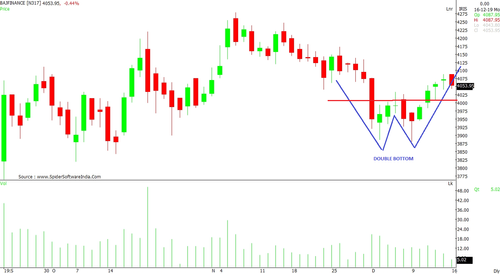
- Bajaj Finance Ltd (BAJFINANCE): Recently, this counter has shown a reversal from two distinct levels – Rs 3,886 and Rs 3,880 – as per the daily chart. This reversal indicates “Double bottom” pattern, which crossed the break-out neckline at Rs 4,040 decisively. Normally, the breakout candles needs to have higher volumes, which is true in this case.
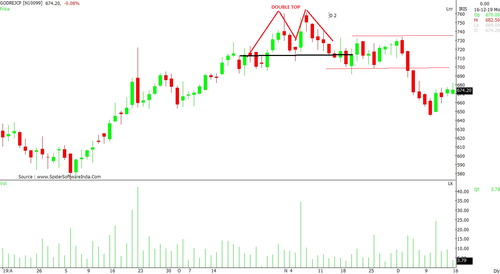
- Godrej Consumer Products Ltd (GODREJCP): After forming higher tops at Rs 760.20 and Rs 761.70 levels in the past few weeks on the daily chart, the counter has witnessed massive selling pressure. A “Double Top” formation with a neckline at Rs 710 was broken decisively. However, the counter made efforts to rebound, which failed to absorb the selling pressure.
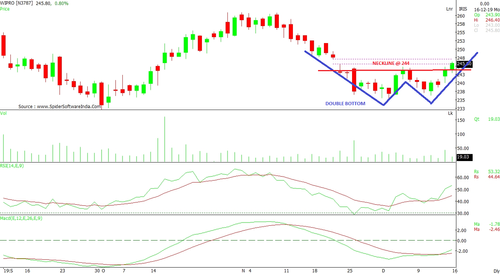
- Wipro Ltd (WIPRO): A closer look at the daily chart of this information technology (IT) major reveals a “Double Bottom” formation on closing a basis with a breakout at Rs 244 levels. The Moving Average Convergence Divergence (MACD) has made a positive crossover and is heading towards the signal line. The Relative Strength Index (RSI) is trading around 50 value, away from overbought condition of 70.
Advantages and Disadvantages of a Double Top & Double Bottom Pattern
Frequently employed in trading and investing are the double top and double bottom patterns from technical analysis. These price chart patterns are said to offer insights into anticipated future price changes. The benefits and drawbacks of each pattern are as follows:
Advantages of Double Top:
A double top pattern provides a visual indicator of a potential trend transition from an uptrend to a downtrend. This may be advantageous for traders looking to capitalise on a change in the market's trend and grasp new profit opportunities. Furthermore, when two peaks at nearly the same price level arise consecutively, a clear resistance level is frequently created. Traders may use this level as a reference point for setting stop-loss orders and profit goals, as well as for enhancing risk management and trade planning.
The breaking of the neckline in a double top formation is an excellent entry point for traders to begin short bets. The neckline serves as a predetermined level at which to join the market and helps determine whether the pattern has been invalidated if the price does not break below it. Additionally, the pattern's height may be utilised to forecast profit objectives, providing traders with a clear window of opportunity to exit.
Volume analysis can provide further certainty that the pattern is correct. Volume typically increases when the price crosses below the neckline and declines when the two peaks are being formed. This loudness increase may further strengthen the pattern's signalling efficacy. In comparison to other techniques, a double top may therefore be more consistent and predictable in some aspects.
Last but not least, traders can decide their profit targets and the likely downside target by detecting a double top pattern, based on the pattern's height. This often offers a strong risk-reward ratio since the prospective profit target is frequently larger than the initial risk (stop-loss).
Disadvantages of Double Top:
Like any other chart pattern, the double top pattern is not perfect and occasionally produces misleading indications. If the price momentarily develops two peaks before continuing to rise, a failed double top pattern might arise. Traders should move cautiously in light of the breach of the neckline and other encouraging indicators.
Finding a double top pattern could entail some subjectivity. Different traders may interpret the peaks and troughs in different ways, as well as how symmetrical the pattern should be. This subjectivity might lead to disagreements and a variety of results among traders.
There is a chance that not all double top designs have identical peaks and troughs or perfect symmetry. Price ranges, completion times, and design shapes are all negotiable. This variety makes it challenging to precisely define the entry and departure points or define the goal levels of the pattern.
The typical method for determining a double-top pattern's downside aim is to project the pattern's height from the neckline. However, the potential profit objective may be limited in relation to the initial risk or stop-loss level. The price may not always reach the forecasted objective, resulting in smaller profits than anticipated, depending on the status of the market.
Advantages of Double Bottom:
The double bottom pattern is a bullish reversal pattern, much as the double top pattern. It develops following a downward trend and indicates that the trend may be changing to an upward trend, offering prospective purchasing opportunities.
The double bottom pattern gives distinct entry and departure locations, just as the double top pattern. The exit point can be chosen depending on the anticipated price increase, while the entrance point is frequently placed above the neckline.
The pattern's authenticity may also be verified via volume analysis. As selling pressure lessens, the volume of the second dip should ideally be lower than the volume of the first.
Disadvantages of Double Bottom:
Not all double-bottom patterns result in notable price reversals, just like the double-top pattern. It's possible for some patterns to fail to manifest, producing wrong signals. Double bottom patterns can be subjectively identified, just like any other technical pattern. On the precise details that characterise the pattern, traders could disagree.
The study of the double bottom pattern must be done within a specific timeframe. Compared to shorter intraday time periods, it performs better in longer time frames. Despite the fact that the double bottom pattern suggests a probable reversal, it cannot be used to determine with certainty the size or timing of the price gain.
How Can Traders Use These Patterns?
When trading using double-top chart patterns, traders should bear the following things in mind.
- The size of the tops should be noted as traders search for two circular tops.
- Only once the price has broken through a neckline or support level may traders take a short position.
- In this specific instance, traders can trail according to the risk management method and set their stop loss at the second top of the pattern.
These guidelines can help traders trade more successfully with double-bottom chart patterns.
- The magnitude of the bottoms should also be taken into account as traders search for two rounding bottoms.
- Only when the price crosses above the neckline or the resistance level may traders open a long position.
- The stop loss must be set at the second bottom of the double-bottom pattern.
Conclusion
Even while chart patterns like the Double Top and Double Bottom may be used to spot trends and pinpoint entry and exit points, traders must always check other indications before taking a position. Although the Double Top and Bottom patterns are difficult to overlook, an upward or downward trend must come after them, respectively. Keep in mind that by misinterpreting a Double Top or Double Bottom pattern, many traders restrict their gains or even incur losses. Therefore, before taking a position, take careful to consider additional signs such as volume and market cycles.
Double top and bottom patterns FAQ's
Look for two similar-sized price peaks that are followed by a decrease (double top) or two similar-sized price troughs that are followed by an increase (double bottom). The neckline can be determined by drawing a line connecting the highs or lows.
In a double top pattern, the lows between the peaks and the highs between the troughs are connected by a horizontal line called the neckline. It acts as a support or resistance level, and when it is breached, the pattern is confirmed.
Indeed, trends can fail to result in the anticipated price change. Price behaviour may be affected in ways other than those predicted by the pattern due to market circumstances, unanticipated news, or shifts in attitude.
Double top and bottom patterns may appear in a variety of periods and markets. Their frequency varies according to the state of the market and changes in the price.


