What Is The Death Cross Pattern And How To Make Use Of It While Trading?
- 4m•
- 2,048•
- 14 Aug 2023
The "Death Cross" pattern is one of the most effective technical instruments in identifying a major trend reversal in any stock/index. Simply put, it explains how the negative convergence of moving averages impacts the upward trend and pushes prices into a bearish phase.
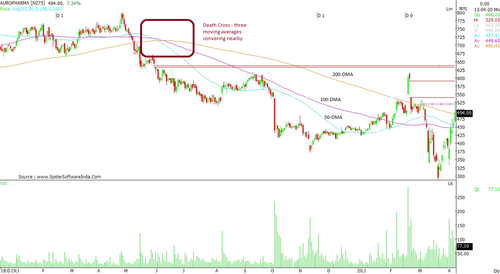
Technically speaking, the Death Cross is the negative crossover of short-term moving average to a long-term moving average. Broadly, the 50-day moving average (DMA) and 200-DMA are taken into account to identify a Death Cross pattern. That said, other moving averages may also show a weakness when they witness similar formation. Negative convergence can lead to severe selling pressure and the price may stay weak for one month to a year.
Key components
The Death Cross having more moving averages converging together shows a very strong indication of a sell-off.
If the volume after the Death Cross shows a significant rise, then the downward trend is likely to gain strength.
If the price trades above the moving averages, then the selling pressure may require strong volumes to suggest a major turnaround. Otherwise, the price may hold support around the same moving averages.
If the price is below moving averages, then the impact and selling pressure is likely to be severe. In such a case, any positive corrective move will witness strong resistance at every higher level.
The first sign of selling pressure gets deteriorated as these moving averages start turning upward.
As the moving averages get closer indicating a possible Death Cross on the charts, the amount of rise in a stock price starts indicating selling pressure with higher levels showing strong resistance. This attribute helps short-sellers to gauge early indications of change in trend. One can also notice that during the formation of a Death Cross, all other technical patters start showing negative signs in their respective parameters.
Death Cross versus Golden Cross
While Death cross indicates the negative crossover of moving averages, the Golden Cross depicts a positive reversal. Herein, the moving averages converge in an upward direction suggesting a strong positive upside. This upward momentum exhibits firm positive sentiments with price scaling higher levels in the subsequent sessions.

Death Cross and chart patterns
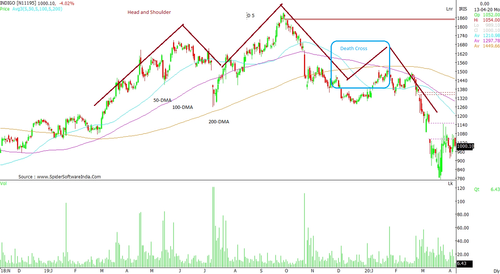
Whenever the Death Cross is accompanied by chart patterns like Head and shoulder, double top, etc., the signal gives strong confirmation without any bias and the trend witnesses a steep correction in price. The price is very relevant in providing confirmation of a trend and, if supported by any other instrument like trend line breakdown, consolidation breakdown, gap down, bearish engulfing; then the weakness sees strong negative momentum with price eventually entering the bearish phase.

Indications provided by a Death Cross pattern: A major shift in sentiment from bullish to bearish phase.
An ideal indication of shorting opportunities with short to medium-term perspective.
If the index of a particular sector forms a Death Cross, then the price of all those stocks in the sector will not show any rise in price, no matter whether those stocks have formed the Death cross or not.
The volumes accelerate if the counter closes in negative sessions for over three days.
Finding a bottom is highly discarded in a Death Cross formation.
Popular Stocks
| Stock Name | Market Price | ||||||||
|---|---|---|---|---|---|---|---|---|---|
- | |||||||||
- | |||||||||
- | |||||||||
- | |||||||||
- | |||||||||
- | |||||||||
- | |||||||||
- | |||||||||
- | |||||||||
- | |||||||||
Check Share Market Today | |||||||||


