• Invest
    Investment Suite
    Stocks
    Mutual Funds
    Future and Options
    IPO
    Exchange Traded Funds
    Commodity
    Stockcase (Stock Baskets)
    Currency
    Non Convertible Debentures
    Sovereign Gold Bond
    Exclusive
    NRI Account
    Private Client Group
    Features
    SipIt
    MTF
    Investment Suite
    Exclusive
    Features
  • Platform
    Product Suite
    Kotak Neo App & Web
    Nest Trading Terminal
    NEO Trade APIs
    Features and Tools
    MTF
    Securities Accepted as Collateral
    Margin Requirements
    Equity Screeners
    Payoff Analyzer
    Calculators
    SIP Calculator
    Lumpsum Calculator
    Brokerage Calculator
    Margin Calculator
    MTF Calculator
    SWP Calculator
    CAGR Calculator
    Simple Interest Calculator
    ELSS Calculator
    Step up SIP Calculator
    All Calculators
    Product Suite
    Features and Tools
    Calculators
  • Pricing
  • Research
    Research Calls
    Long Term calls
    Short Term calls
    Intraday calls
    Derivatives calls
    Pick of the week
    Top Monthly Picks
    Research Reports
    Fundamental Research Report
    Technical Research Report
    Derivative Research Report
    Research Calls
    Research Reports
  • Market
    Stocks
    Market Movers
    Large Cap
    Mid Cap
    Small Cap
    Indices
    Nifty 50
    Bank Nifty
    FinNifty
    Nifty Midcap India
    VIX
    All Indian Indices
    Mutual Funds
    SBI Mutual Funds
    HDFC Mutual Funds
    Axis Mutual Funds
    ICICI Prudential Mutual Funds
    Nippon India Mutual Funds
    All AMC's
    IPO
    Upcoming IPO
    Current IPO
    Closed IPO
    Recently Listed IPO
    Stocks
    Indices
    Mutual Funds
    IPO
  • Learn
    Resource
    Market Ready
    Kotak Insights
    Infographic
    Podcast
    Webinars
    Youtube Channel
    Quarterly Results
    Investing Guide
    Demat Account
    Trading Account
    Share Market
    Intraday Trading
    IPO
    Mutual Funds
    Commodities
    Currency
    Futures & Options
    Derivatives
    Margin Trading
    Events
    Budget 2024
    Muhurat Trading
    Share Market Holiday
    Market Outlook 2025
    Resource
    Investing Guide
    Events
  • Partner
    Business Associates
    Fund Expert
    Kotak Connect Plus
    Startup connect
  • Support
    FAQs
    Circulars
    Bulletins
    Contact Us
    Forms Download
    Get your Statement

Candlestick Pattern, Trendline: Charting Tools You Can Use To Your Advantage

  •  4m
  • 0
  • 19 Apr 2023

In trading, timing is everything. This is one thing savvy traders who buy and sell stocks based on technical chart patterns swear by. While most market pundits and investors give out tips on what and when to buy, the ‘sell calls’ are often missed. Both the components – the time to buy and time to exit a position - are significant and have a bearing on the money / return you make.

There are two ways to identify stocks showing a weak trend. One is on the price itself and other on oscillators or momentum. The price-based study involves several chart formations, including Head and Shoulder, Double Top, Rising Channel Breakdown, Triangles and Rounding Top.

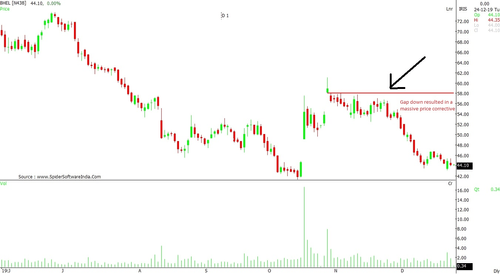
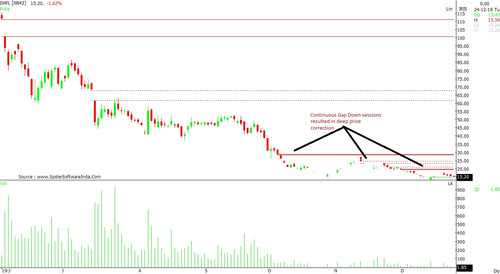
Even Candlestick patterns help to determine moves that the stock is likely to make in the sessions ahead. Some of the popular and widely used Candlestick patterns include Bearish Engulfing pattern, Bearish Harami, Bearish Harami Cross and Bearish Dark Cloud Cover. A gap-down close indicates selling pressure, which if not filled soon, can take the stock down further and dent the overall sentiment.
Trendline also plays a crucial role. A break in the trendline on strong volumes breaks the positive sentiment. A trend line is a bounding line for the price movement of a security, which is formed when a diagonal line can be drawn between a minimum of three or more price pivot points. Though a line can be drawn between any two points as well, it does not qualify as a trend line until tested. Hence the need for the third point.

Trend lines are commonly used to decide entry and exit timing when trading stocks. Traders who are play the market from a short-term horizon tend to use charts based on interval periods such as 1 minute (i.e. the price of the security is plotted on the chart every 1 minute). On the other hand, with traders with a long-term view use price charts based on hourly, daily, weekly and monthly interval periods.

The Moving Averages also help in determining the medium-term outlook for the stocks, while a Crossover decides the trend that can significantly influence the direction. Gaps are areas on a technical chart where the price of a stock (or another financial instrument) moves sharply up or down, with little or no trading in between. As a result, the asset's chart shows a gap in the normal price pattern.
Did you enjoy this article?

0 people liked this article.

What could we have done to make this article better?

Read Full Article >
Enjoy Free Demat Account Opening
+91 -

personImage
Enjoy Free Demat Account Opening
+91 -

N
N
[object Object]
[object Object]
[object Object]
[object Object]
[object Object]
[object Object]
[object Object]
[object Object]
[object Object]
[object Object]
[object Object]
[object Object]
[object Object]
[object Object]
[object Object]
[object Object]
[object Object]
[object Object]
[object Object]
[object Object]
[object Object]
[object Object]