Key Sell Signals You Should Be Aware Of While Trading
- 4m•
- 1,507•
- 13 Apr 2023
One needs to examine several elements in order to determine a negative reversal, or a 'sell signal', for a stock or index. The most relevant is the price movement, followed by price indicators like candlestick patterns, chart formations, moving averages, trend line, gap up or gap down, etc.
Apart from the above-mentioned instruments, technical indicators like Relativem Strength Index (RSI), Moving Average Convergence Divergence (MACD), and Stochastic also assist in identifying the trend reversal. Volume plays a crucial role in acknowledging the change in momentum.
When considering a larger outlook, one needs to look at signals wherein the change in trend holds over a month or a quarter.
Here are some 'sell' signals to keep an eye on.
Similarly, Evening Star, Bearish Engulfing and spinning top with a negative candle show a short selling reversal. In these patterns, volumes yield a significant role in providing a firm confirmation. A large volume surge during a breakout suggests a positive outlook.
Moving Average:
Moving average is the average of the price over a certain period of time. To spot a trend reversal or confirm the start of a negative trend, one needs to co-relate more than one average. The basic averages are 50-day moving average (DMA), 100 DMA, and 200-DMA. They all facilitate support and resistance besides assisting technical indicators.
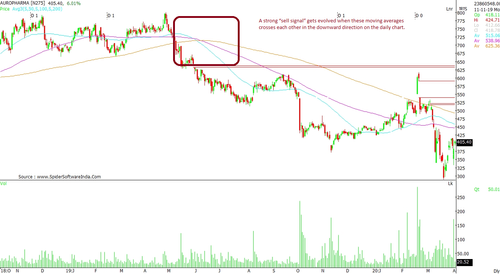
To review from a bigger perspective, one should consider the convergence of these three essential moving averages. A strong “sell signal” evolves when these moving averages cross each other in the downward direction on the daily chart. This indicates that the trend has turned bearish and the price is heading towards a deeper correction. Sometimes, the price shows positive reversal which eventually witnesses selling pressure, resulting in price correction. The price correction exists till the moving averages do not show a reversal. For a sell momentum to slow down, the moving averages must change to upward direction, indicating a shift in the closing prices.

Chart Patterns:
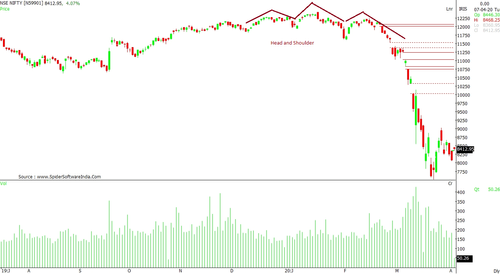
If you spot one of the trend reversal patterns on a breakdown, it may be a sign of further selling pressure in the stock/index. These patterns include Head and Shoulder, Double top, Triple Top, Breakdown in symmetrical triangle, descending triangle, rising channel pattern, trend line breakdown, etc.
Among these patterns, Head and Shoulder and Double Top are the most tracked ones. Even Trendline Breakdown has been identified as one of the most accurate trend reversal patterns. These patterns typically show the stock witnessing selling pressure at higher levels. Going ahead, the selling pressure starts to generate volumes, suggesting the resistance has encouraged short positions. If the counter does not overcome the selling pressure conquering the high levels, the fall or correction intensifies, leading to price correction on stronger volumes. The target price is the difference between the neckline and the high price of the pattern.
Sometimes, the correction after a breakdown leads to a bearish sentiment that can last for a year. A candlestick pattern on the “breakdown neckline” also helps in acknowledging the strength of the falling price. If you can spot formations like the Evening Star, Doji or Bearish Engulfing, it may help confirm a sell signal.

Technical Indicators:
Various technical indicators help in trading or identifying a trend reversal. The main ones are RSI and MACD. The RSI reveals the strength by identifying the overbought and oversold condition, whereas the MACD locates the price momentum, strength, duration and direction of the counter.
Relative Strength Index (RSI):
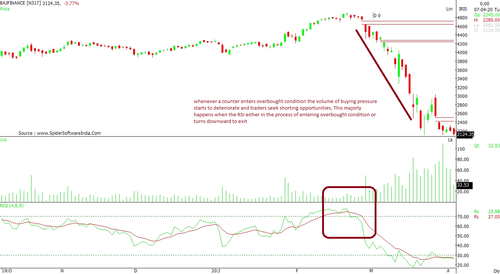
It is relatively difficult to recognize a trend reversal when the RSI trades between the oversold and overbought condition. For a sell signal to emerge, the overbought condition should coincide with profit booking or trend reversal. Primarily, whenever a counter enters overbought condition, the volume of buying pressure starts to deteriorate and traders seek shorting opportunities. This mainly happens when the RSI is about to enter the overbought condition or turns downward to exit.

Moving Average Convergence Divergence (MACD):
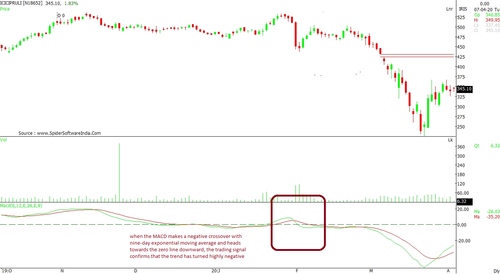
The best signal on this indicator is the zero line that differentiates between the positive and negative strength as well as the direction. Simply put, when the MACD makes a negative crossover with nine-day exponential moving average and heads towards the zero line downward, the trading signal confirms that the trend has turned highly negative and the counter is moving towards a bearish sentiment.
That said, both the indicators co-relate with the price. The counter needs to confirm a trend with a strong negative close; otherwise, the sell signal may see lower strength, inevitably with lower downside.


