

How To Identify Which Timeframe Suits Your Trading Behaviour?
- 4m•
- 1,185•
- 14 Aug 2023
Technical analysis helps in developing trading strategies for various timeframes. This could be for a week, fortnight or a month. Depending on the analysis, one can take a long or short position for various time schedules. Broadly, a trader who looks for short-term gains hold positions for a week or fortnight, whereas those eyeing bigger gains hold positions for a month.
Outlook for a month: To look for monthly opportunities, the major indicator that highlights a trend is the moving average. A moving average is defined as an average of price over a certain period of time. Normally, 50-monthly moving average (MMA), 100 MMA and 200 MMA help to analyze the strength of a stock or an index.
Whenever a stock or an index crosses 50-MMA, along with 100-MMA moving upward, it indicates that the counter is building an upside momentum. Even when these moving averages converge with each other, it is obvious that the stock will render a strong upside. In certain cases, these moving averages also help in adding stock positions on their corrective moves.
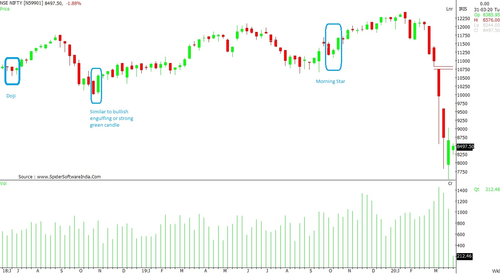
Outlook for a fortnight: For a fortnightly view, candlestick patterns have always been the strongest indicator for safe signals. In the bullish sentiment, the patterns are Morning Star, Bullish Engulfing and Doji with an immediate positive candle. These serve as indicators for the upward trend.
Similarly, Evening Star, Bearish Engulfing and spinning top with a negative candle show a short selling reversal. In these patterns, volumes yield a significant role in providing a firm confirmation. A large volume surge during a breakout suggests a positive outlook.
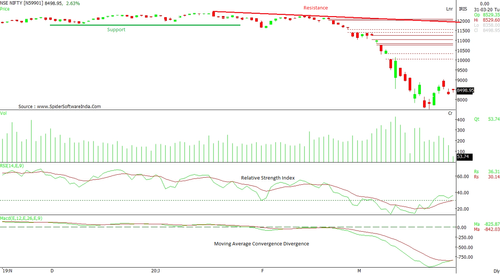
Outlook for a week: A short-term trade may be considered on various factors such as technical indicators. Relative Strength Index (RSI) and Moving Average Convergence Divergence (MACD) or price indicators like support and resistance fall under this category of deciphering a weekly trend. The trend line also assists in developing a breakout strategy. The underlying strength needs to be gauged to assess the overall broader trend.
Besides knowing the daily formation, an analysis of intra-day momentum also guides in acknowledging the turnaround or break out in stock. Usually, 15 minutes to an hour chart assist in decoding a fair outlook. In the intra-day study, one can focus on volumes, overbought and oversold conditions and even moving averages like 8-DMA, 21-DMA and 37-DMA.
Other aspects of trading: Besides the above-mentioned indicators, chart patterns can be used in synergies with their applied price targets. Chart patterns like Head and Shoulder, Double Top, Flags, Triple bottom, Symmetrical Triangle, Ascending Triangle, and Descending Triangle also help in determining the trend.
If the larger aspect of trading is associated with identifying a trend, then one should focus on the breakout or breakdown patterns. Usually, traders or investors want to move with a trend and achieve gains with limited risk. However, if one is unable to determine the trend reversal, then the risk factor can turn into an unbearable loss.


