

Here's Your Guide To Trading With The Ichimoku Cloud Indicator
- 4m•
- 1,709•
- 19 Apr 2023
Ichimoku Cloud is a widely used indicator, built by Japanese journalist Goichi Hosoda, and published in the late 1960s. This indicator uses moving averages to identify support and resistance levels. Moreover, it also throws light on price momentum and trend direction. With all these combinations, the indicator has acquired a 'cloud' methodology to identify reversal, support, and resistance levels while also facilitating the prediction of future directions.
The Ichimoku Cloud comprises five lines among which two demonstrate a cloud. These include Conversion line, Base line (confirmation line), lagging line, and the cloud (includes two lines -- 'Span A' and 'Span B').
These combinations include a 9-day average, 26-day average, an average of those two averages, a 52-day average, and the closing price line. The significance is given highly to the signal established by the cloud. The price trading above the cloud shows a positive trend and when the price trades below the cloud, it signifies a downward trend.
How To Read Ichimoku Cloud
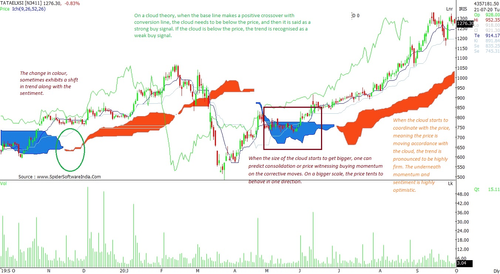
The change in colour, sometimes exhibits a shift in trend as well as sentiment.
As the cloud's size expands, one can assume consolidation or price witnessing buying momentum during the corrective moves. On a bigger scale, the price tends to move in a single direction.
When the cloud starts to move in accordance to the price, the trend is dubbed to be highly firm. The underlying momentum and sentiment is highly optimistic.
It is highly inappropriate to trade when the price is within the cloud. This may result in high volatility and wild swings.
When the base line makes a positive crossover with the conversion line, the trend is recognized as bullish. Conversely, a negative crossover depicts the bias towards the negative trend.
If the lagging line is trending upward; the negative signals of base and conversion lines are avoided. Herein, the lagging line trading above the price reflects an upward trend and vice-versa.
According to the cloud theory, when the base line makes a positive crossover with the conversion line, the cloud needs to be below the price for it to be a strong buy signal. If the cloud is below the price, the trend is recognised as a weak buy signal. Similarly, in a negative crossover of the base line, the cloud needs to be above the price to affirm a strong negative signal.
Ichimuko Cloud provides excellent signals when the market is trending. Sideways movement often exhibits lagging signs.
Ichimoku Cloud Breakout
As mentioned above, the cloud is made up of two lines: Span A and Span B. The upper line is 'span A' and the bottom line is 'span B'. When the price crosses the cloud upward, thus conquering span A line with price trading above the cloud, the trend is said to be highly bullish.
On the other hand, when it breaches the cloud downward, breaking Span B line with the price staying below the cloud, the trend reflects highly bearish sentiment.
Likewise, during the positive cloud crossover, if the price is below the cloud, the trend is said to be mildly bullish. Similarly, a negative cloud crossover with price placed above the cloud suggests a weak negative sentiment.


