Here's Why Moving Averages Are A Must For Your Trading Model
- 4m•
- 1,955•
- 21 Apr 2023
One of the simplest techniques to gauge the trend of a stock/market is Moving Average. It is classified as the average value of a security over a specified period. Usually, when the price trades above the average, the trend is considered as bullish and when the price falls below the average, the sentiment is said to be bearish.
Most Common Moving Averages
There are various moving averages that assist in identifying the sentiment of a stock. The basic and most effective averages are 50-day moving average (50-DMA), 100-DMA, and 200-DMA. The combinations of these moving averages often indicate substantial movement in the stock price.
Intra-day traders consider lower averages (eg: 9-DMA, 13-DMA, 20-DMA) as this helps traders with swing trades wherein they want to capture profits on the day-to-day basis while mitigating risk.
From a broad perspective, the major moving average tracked is the 200-DMA. Securities trading above or crossing 200-DMA on the monthly chart attract attention from even investors, resulting in a steady up trend that later on builds follow-up buying.
Significance Of Moving Average (MA)
As the average is arrived on the basis of past data points using a mathematical formula, it assists in filtering out the ‘noise’ and attempts to provide a smooth and clear view on the securities.
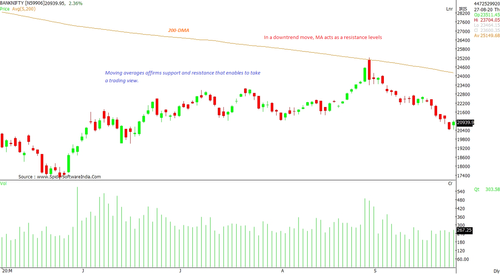
Moving averages affirm support and resistance that enable one to take a trading view
The intersection of moving averages helps one acknowledge the shift in sentiment.
In trending markets, MAs help one understand the corrective support levels
In a downtrend move, moving averages act as resistance levels. (Nifty Bank chart)
Variants of moving averages
There are two types of moving averages: Simple moving average (SMA) and Exponential moving average (EMA). The SMA gives equal weightage to all the data points; while, EMA applies more weight to the recent data. The EMA facilitates trading when one is attempting to make swing profits, or quick trades, as it reflects change in move rather quickly. Whenever the stock breaks out above the hurdle, the EMA provides a swift signal.
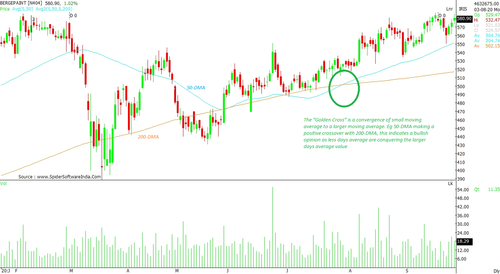
Golden / Death Cross
The crossover of moving averages is commonly recognized as a trading signal. This reflects the change in sentiment which inevitably impacts the price. The 'Golden Cross' is a crossing of small moving average with a larger moving average. eg 50-DMA making a positive crossover with 200-DMA, which indicates a bullish outlook as the shorter moving average is conquering the longer moving average value. Likewise, 'Death cross' gives a negative outlook with the 200-DMA crossing the 50-DMA negatively, suggesting a bearish mood going forward. (Berger paint chart)