What Is The ‘Hanging Man’ Pattern And What Is Its Significance In Trading?
- 4m•
- 1,333•
- 18 Aug 2023
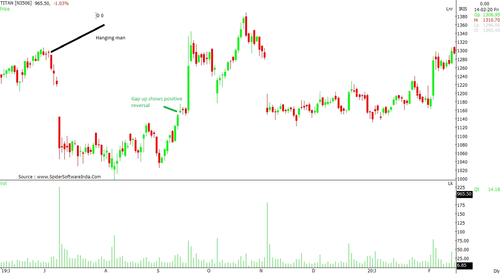
In technical analysis, Hanging Man is a candlestick pattern that indicates a bearish reversal trend with selling pressure emerging at higher levels. The pattern involves a small real body and a long lower shadow with an upper shadow staying low. This suggests that the sellers are entering the markets and the bulls are getting tired as the prices start showcasing weak close.
This candlestick pattern provides the first sign of weakness and if the price fails to conquer the high of the “Hanging Man”, then the weakness may turn into a major bearish trend and the counter may gain momentum with an increase in volumes as the session progresses.
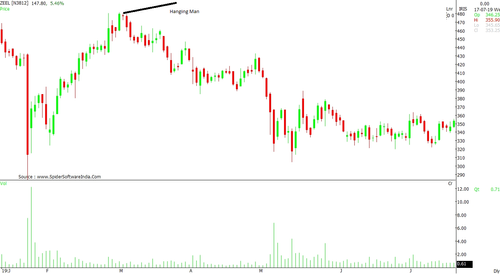
Significance of Hanging Man: The candlestick pattern mostly occurs at the top of the trend. · If the immediate session follows a red candle / negative close, then the confirmation gets more concrete. · The candlestick having a small body with open and close prices staying nearby suggests short sellers conquering the momentum. · The Hanging Man may show distortion, however till the high of the candlestick is not broken, one needs to be cautious on the upside. · Technical Indicator such as Relative Strength Index (RSI), if traded in an overbought condition at the Hanging Man, the confirmation signal becomes even stronger.
Difference between Hanging Man and Hammer Candlestick patterns: The Hammer appears on the downtrend, especially when the prices witness rapid fall. · Hanging man pattern is identified as a bear reversal, whereas Hammer as Bull reversal. · Hanging Man needs confirmation on immediate negative close, however, Hammer may show strength on a single parameter of volume.
How to make use of Hanging Man: During the bearish trending scenario, the Hanging Man may not give proper downside. However, in a bullish market, the pattern shows a change in trend. Ideally, the pattern has a strong base in an upward trending market. A gap down close after Hanging Man reveals the underneath bullish trend has weakened and any upside should see aggravated selling pressure.
If the Hanging man pattern gets violated, the counter still witnesses selling pressure at higher levels. Furthermore, in case the pattern shows distortion, the prices will still reflect weakness and enter into a short-term consolidation that may exist for 5 – 10 sessions.
The better the pattern and duration of the chart, the better the indication of price trends. The weekly and monthly charts involve weakness that may persist a couple of months. The very short-term reaction, meaning intraday structure might not give a satisfactory outlook and so should be avoided.
The target price or the reversal of Hanging Man can be noted when the stocks start showing either "Doji" or "Hammer "pattern. The candlestick pattern usually indicates reversal with rising volumes. The volume structure could drive the prices to the higher resistances.
Secondly, if the chart structure shows a positive reversal with a gap up close, then one needs to consider the volume and may opt for profit-booking. The reversal may see a sharp up move, however till the candlestick formation does not show underneath trend, the hanging man still stands firm in the negative bias.