All You Need To Know About Stock Quotes
- 3m•
- 2,094•
- 22 Feb 2023

The stock market is an important avenue for investment. As an investor, you pay money and buy a few stocks, which then reap dividends over your investment horizon. There are over 5,000 stocks listed on the exchange. Each needs to be identified in a way that sets it apart from the other stocks listed. This is where stock quotes play an important role.
Here's a look:
What Are Stock Quotes?
You must have often seen a ticker on a business news channel on the TV or on the huge billboard outside the Bombay Stock Exchange, constantly showing a bunch of letters and numbers in green or red lettering. These are stock quotes. The bunch of letters you see is a stock symbol, while the numbers that follow signify the stock price.
What Are Stock Symbols?
A stock symbol is a unique code given to all companies listed on the exchange. Once you know the stock code or symbol of the company, you can easily obtain information about the company. This is important for investors who wish to conduct a financial analysis before purchasing a company’s shares. For example, TCS stands for Tata Consultancy Services, while INFY stands for Infosys. Often, it is not possible to write the full name of a company. It would take up a lot of space on the ticker board or stock table. In such a case, the stock symbol comes handy and it is just 3-4 letters. For this reason, stock symbols are also referred to as ticker symbols. So, when you are searching for a stock on Kotaksecurities.com or on the exchange’s site, typing the stock symbol will directly lead you to the company’s page, which will give you all possible details.
Where Are They Available?
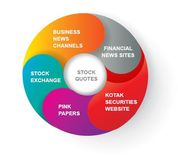
Stock quotes are available very easily. Some of most accessible avenues to get stock information are the internet and business news channels. Pink papers or business newspapers also regularly publish a list of stock quotes, called the stock table. You could alternatively access the Kotak Securities website and get all the information that you wanted within a matter of seconds.
What Should I Read in A Stock Quote?
When you invest in a stock, you need to know the stock price as well as its historical trends. This is imperative if you wish to invest in a valuable company at the right time. This will ensure that you not only get the stock right, but also the share price. Remember, if you wish to maximize your profits in the stock market, you need to buy at lows and sell at highs. So timing is of utmost importance. A stock quote gives you the information required to make this buying/selling decision. So, you need to track stocks continuously for a period of time before making a buying or selling decision. Tracking stocks lets you gain from the best stock opportunities available in the market. It also helps you know monitor how the stocks in your portfolio are performing. No, it is not as complicated as it sounds. The Kotak Securities website can help you. It is designed to empower you with all the tools you might require to invest wisely. You have the Portfolio Tracker Section, which lets you regularly monitor your portfolio. You can also track other stocks you wish to purchase, while keeping pace with all market activities with our Research Section that empowers you with intensive market-related research reports.
-
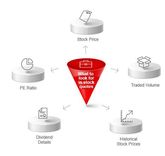
How To Read Stock Quotes?
The stock table – available in financial papers and online – contains the information of all stocks. It can be a little confusing to understand. It has the following elements:
-
Company Name And Symbol:
The stock table needs space to fit in details of as many shares as possible. There is thus a space crunch. For this reason, company symbols, and not names, are used. On the internet, though, company’s names too are given. This helps you identify the stock.
-
High/Low:
During market hours, live share prices keep changing as more trades are conducted. This is because buying makes the stock more valuable, while selling makes it less valuable. This in turn affects the share price. To give an investor a basis for comparison, the stock quote mentions the highest and lowest prices the stock hit in that day. If the share price is constantly rising, the ‘high’ would keep climbing. In the same way, the ‘low’ would keep falling in a down market. Once the market closes, the difference between the highest and the lowest prices gives an idea about the volatility in the stock’s price.
-
Net Change:
The closing price also helps calculate how much the stock’s price has changed. This change is written in both percentage as well as absolute value format. It is calculated by subtracting today’s price from the previous closing price, and then dividing with the closing price to get the percentage change. A positive change indicates the stock price has increased from the previous day. When the net change is positive, the stock is written in green colour, while red colour is used to denote share price has fallen.
-
Dividend Details:
Companies distribute a portion of their profits to shareholders as dividends. While an investor holds the share, dividends are the primary source of income. For long-term investors, this is of great importance. This is because higher dividends mean greater returns for the investor. For this reason, many stock quotes mention the dividend yield, which helps compare the dividend with the share price. The dividend yield is calculated by dividing the dividend per share with the stock price. Higher the dividend yield, greater is the investor’s income through dividends.
-
Stock Price:
This is the price an investor or trader pays to buy a single share of the company. This fluctuates constantly during market hours, and remains constant when markets are closed for trading. It reflects the value the market has allotted to the company.
-
Close:
Stock prices stop fluctuating once the market is shut for trading. The ‘close’ or the ‘closing price’ thus reflects the last price at which the stock traded. During the market hours, it represents the previous day’s closing price, again giving investor a benchmark to compare against. Since the newspaper is delivered in the morning, it reflects the price at which the stock closed the previous day.
-
52-week High/Low:
This shows the highest and lowest stock price in one year or 52-weeks. This too helps the investor understand the stock’s trading range over a broader period of time.
-
PE Ratio:
Some stock tables and quotes also mention the PE ratio. This is the amount an investor pays for each rupee the company earns. It is calculated by dividing the stock price with the company’s earnings per share. This is important because stock price is a market-assigned value. It largely depends on market sentiment about the stock, and hence may not be in synchronization with the share’s internal value. The PE ratio, thus, helps give perspective about the share’s value in comparison to the company’s financial performance. A high PE ratio means the stock is costly, while a low PE ratio means the stock is cheaply available.
-
Volume:
If a company has a stipulated number of shares floated on the exchange, not all of them may be traded in a single day. It depends on demand for the stock. This is understood in the ‘volume’ section of the stock quote, which shows how many stocks changed hands. A higher trading volume is usually followed by a significant change in the stock price.
Open your demat account and trading account with Kotak Securities today