Want To Start Trading As A Beginner? Learn These Candlestick Patterns
- 4m•
- 1,304•
- 24 Apr 2023
As a beginner in stock market, one should always look for trades that can give a decent return with limited risk. The price itself denotes the basic movement, which can be analysed basis the structure and formation of the candlestick on the technical charts.
A Candlestick demonstrates high, low, open and close prices of the instrument / stock or an index. It defines the price movement and depending on the formation, one can determine the current sentiment and predict a trend.
Types Of Candlesticks:
A candle can take various forms and could be a long-body candle, hammer, doji, spinning top, etc. Depending on the closing price of the stock – a green / positive close indicates a positive trade and a red close shows a negative/ weak trend.
A Long-Body Candle:
These are candles that have a bigger body and are indicative of a short-to-medium term sentiment. A strong green close having a green body indicates that the buyers are queuing up to buy the stock and it is likely to gain momentum in the sessions ahead. On the other hand, short body candles are indicating of a weakening trend.
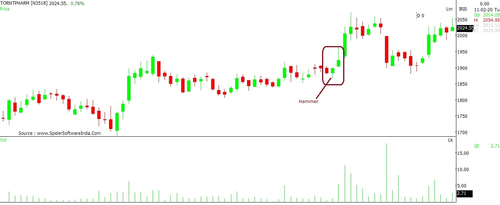
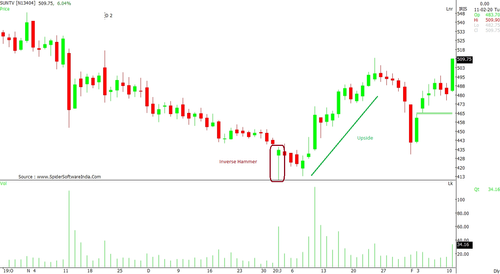
Hammer/Inverted Hammer:
This candlestick represents a change in a trend to a bullish view. This pattern is normally seen at the when the stock has been losing ground and where the likelihood of reversal remains high. The difference among these a hammer and an inverted hammer is the formation of long-leg shadow. In Hammer, the shadow is formed at the high point of the candle, while in Inverted Hammer, the shadow forms on at the lower-end of the candle.
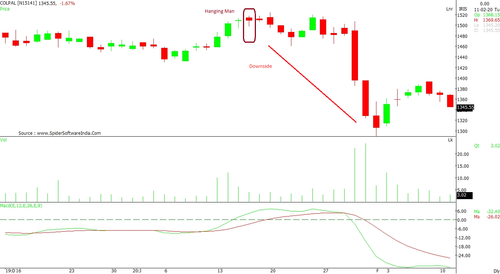
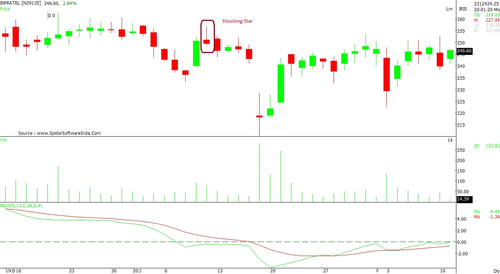
Hanging Man/ Shooting Star:
These candles majorly denote a negative reversal and mostly appear on the top of the uptrend. The red candles followed by another negative close confirms weakening trend. The difference in these two candles is that the Hanging Man has a shadow on the low point of the price/candle and the Shooting Star has a shadow at the higher end of the candle / price.
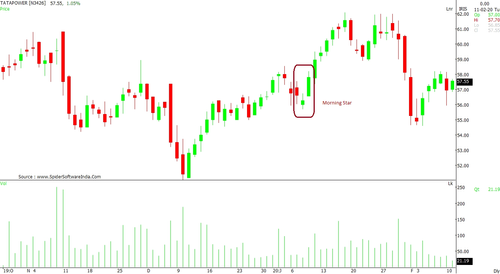
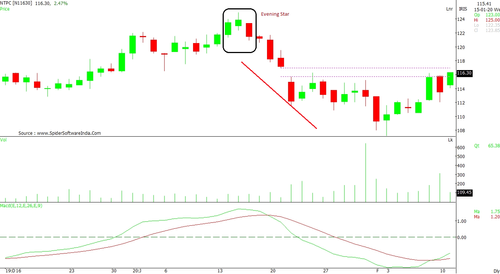
Morning Star/ Evening Star:
The Morning Star shows a positive trend reversal and Evening Star suggest a negative reversal. In both the patterns, three candles are identified to gauge whether the pattern is Morning Star or Evening Star. In case of a Morning Star, the first candle is red followed by small-body candles which are also red, suggesting the correction has come to a halt. The immediate candle after these bunch of red candles is a green, longer body candle, indicating that the sentiment is turning bullish. This formation indicates a beginning of a positive trend. The Evening Star, on the other hand, appears on the top of the price trend, with the first candle being green, which is followed by a small-body red candle. The next candle after this formation is a long-body red candle that shows aggressive selling pressure.
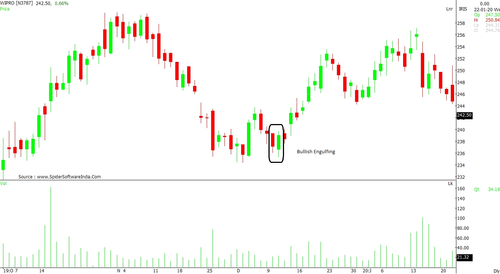
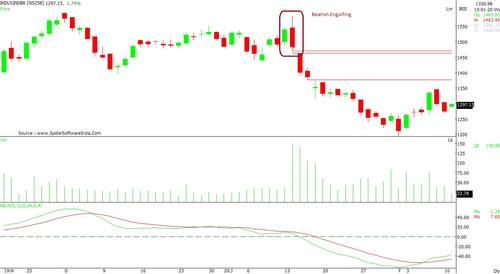
Bullish Engulfing/Bearish Engulfing:
A bullish engulfing pattern can be identified when a small black candlestick, showing a bearish trend, is followed the next trading day by a large white candlestick, showing a bullish trend. Bullish engulfing patterns tend to signify trend reversals, analysts pay particular attention to them. In a Bearish Engulfing pattern, the red candle engulfs the green, signaling sellers are getting a firm grip on the markets / stock.
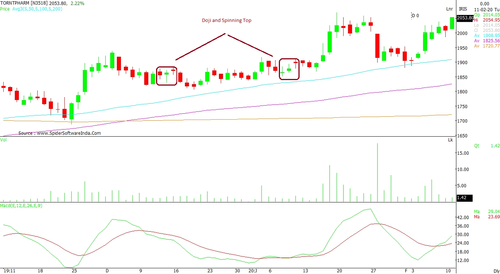
Doji/Spinning Top:
When the instrument indicates indecision, meaning the opening price and closing price remain in close proximity to each other, the trend suggests an inability of traders to take any direction. In such scenario, the immediate next day candle whether is it red or green inhabits the next trend.