How To Use Directional Movement Index In Trading
- 3m•
- 1,506•
- 13 Apr 2023
Whenever, the +D and -D make a crossover, the trend is expected to shift in a more concrete manner in the respective trend in all time frames.
The Directional Movement Index (DMI) determines the direction in which the trend is headed, while also providing an idea about the strength and momentum of the trend. In fact, J. Welles Wilder had invented this indicator in order to understand the direction of stocks or indexes.
The indicator tries to identify direction by analysing highs and lows, labelled as positive directional movement (+D) and negative directional index (-D), respectively. The difference between these two is named as directional movement (DX). Herein, when +D is above –D, the trend is said to be upward, with sentiments gradually rising towards optimism. And when –D is above +D, the direction is said to be dominated by negative sentiment.

Key Significance
-
The crossovers of + D and –D are seen as the trigger for buy and sell strategy.
-
Big difference between the two movements suggests a firm and strong momentum.
-
Whenever DX is combined with indicators like RSI and MACD, it tends to perform even better
-
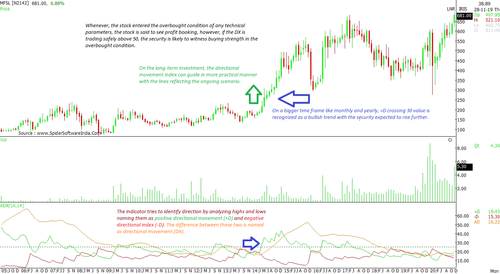
The directional movement index can guide long-term investors in a more practical sense, with the lines reflecting the current scenario
-
Whenever the +D crosses 30 value, the direction is said to have attained extreme buying support and price is expected to scale higher levels. Meanwhile, when it nears the value 50, the trend is expected to witness selling pressure.
How To Use?
Usually, this indicator performs better when combined with other oscillators. However, even the individual signals exhibited by this indicator are very useful. The key in any sort of trading is to identify the direction of a stock's trend. One can find a high price or low price, but if he/she is unable to determine the direction, then the trade setup becomes highly questionable. In that regard, the DMI does assist in identifying the immediate trend in daily and weekly charts. +D rising above 25 value is recognized as a bullish sign and encourages buying momentum, which may see a sudden upside. On the negative side, -D rising above 25 value is considered as a sell / weak signal.
On a bigger time frame like monthly and yearly, +D crossing 30 value is recognized as a bullish trend with the security expected to rise further. Whenever the DX climbs the 50 value, the trend is said to be highly bullish on the daily time frame.
Whenever, the +D and –D make a crossover, the trend is expected to shift in a more concrete manner in the respective trend in all time frames.
That said, usually, this indicator is not used in the intraday time frame as the signals get a little delayed in terms of the sudden spike in security.
In A Nut Shell:
Besides +D and –D, the DX has a significant impact on the security. DX categorically identifies stocks that have or are likely to build strong upward/ bullish sentiment. Whenever a stock enters the overbought condition from any technical parameter, the stock is said to see profit booking. However, if the DX is trading safely above 50, the security is likely to witness buying strength in the overbought condition.


