Here's Why Three Black Crows Are An Ominous Sign For The Stock Market
- 3m•
- 1,633•
- 28 Apr 2023
The 'Three Black Crows' is a candlestick pattern which, when it occurs at the top of any trend, suggests a negative reversal and possible profit-booking in a particular stock or the market in the subsequent sessions. Such a scenario depicts a change in trend, provided higher levels are not conquered in due process. Simply put, this pattern signals a bearish sentiment and one should be cautious once this pattern is visible on the charts.
Three Black Crows consists of three continuous red candles with each having a close lower than the previous candle. In the best scenario, the second and third candles do not cross their respective previous candle's high, thus signifying weakness.
The formation of this pattern has tremendous relevance; however, other indicators like Relative Strength Index (RSI) or Moving Average Convergence Divergence (MACD) do assist in determining the strength and direction of the negative reversal. As such, one should apply these technical indicators, along with the pattern, for confirmation.
How To Identify This Pattern?
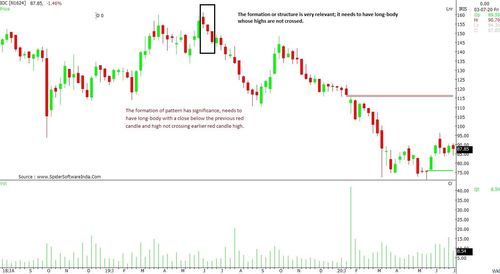
The formation of this pattern is significant. It needs to have a long body with a close below the previous red candle's low and the high should not cross the previous red candle's high.
Volumes facilitate in identifying the buyer/seller view, as rising volumes without wild swings signify a steady upside.
Having RSI in the overbought condition during the formation of “three black crows” confirms a negative reversal.
Till the high of the first red candle is held, the downside or negative trend should persist. This can be considered as a stop loss level.
While trading in any stock, identifying three black crows seems to be a difficult task as the pattern is rare. This formation usually signals trend reversal, but, occasionally, due to several other factors, the trend continues with the same sentiment. And, as such, the formation or the structure of the pattern is very relevant; it needs to have a long body whose highs are not crossed. A Doji, Spinning Top, Hammer are excluded from the pattern.
Timeframe:
This pattern gives a decent outlook of the trend. For maximum impact, traders and investors look at the weekly and monthly charts since the rally is extended to medium-to-long term scale.
Trading with Three Black Crows in intraday or the daily chart may not provide an adequate level of target and the strength of the trend. As the markets are more volatile in this timeframe, any reversal against the trend may see buying at corrective levels.
Traders consider this pattern as one of the ways to identify a trend reversal. A combination of strategies will obviously benefit in entering a trade with strong confirmation. Sometimes, candlestick patterns are dubious as they have several lag and identifying the perfect pattern requires immense knowledge of technical analysis.
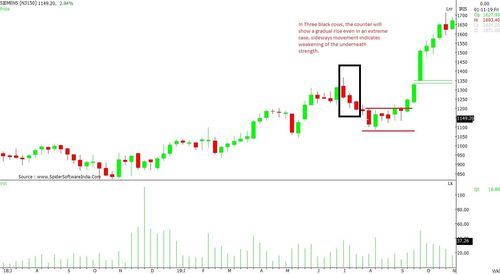
Even in an extreme case of Three Black Crows, the counter will eventually show a gradual rise. After forming this pattern, if the stock enters in a consolidation or shows sideways movement, it means the momentum has slowed down and the underneath strength is weakening. In such a case, one needs to keep a strict stop loss.