Here's How You Can Make Money In The Stock Market Using A Cup And A Handle
- 4m•
- 1,193•
- 13 Apr 2023
In technical analysis, there are various chart patterns—both bullish and bearish that one can use to analyse stock price movement over a period of time. Some of the bullish chart patterns are Head and Shoulder, Double Bottom, Cup and Handle, Flag pattern, Falling channel, Ascending triangle, among others. Of these, Cup and Handle pattern is one of the commonly used technical indicators by the trading community.
The "Cup and Handle" is a bullish continuation pattern, which was developed by William O'Neil, to identify strong upside in the stock. The pattern resembles a cup and handle where the cup is in the shape of a "U" and the handle has a slight downward drift. Normally, the right hand side of the formation has average volumes, and starts rising as the stock breaks out. When the price crosses the upper falling trend line of the downward drift, the stock is said to have broken out. The target is usually the difference between the low of the rounding bottom and the price where the actual breakout happened.
Here's a list of five stocks from BSE500 index which witnessed "Cup and Handle" formation within last three months -
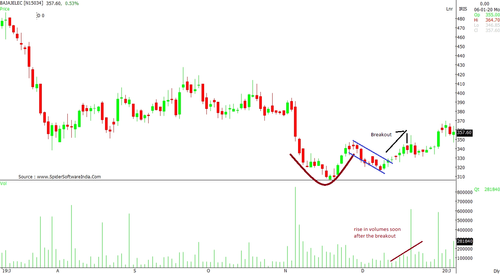
1. Bajaj Electricals (BAJAJELEC)
On the daily chart, the stock saw a severe sell-off when the counter breached Rs 370 in November 2019. After hitting a low of Rs 306.70 level, the counter witnessed a strong reversal. This move then retraced towards Rs 315 before breaking out around Rs 330 levels. There was a rise in volumes soon after the breakout.
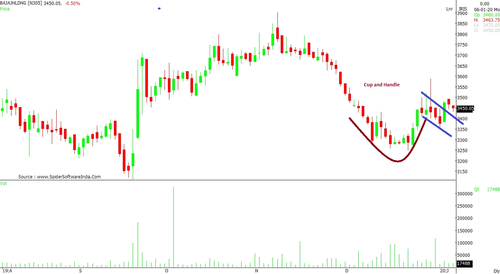
2. Bajaj Holdings & Investment (BAJAJHLDNG)
This counter crossed the significant resistance of Rs 3,450, as per the daily chart. The formation showed a breakout of Cup and Handle with low volumes. It witnessed rounding bottom formation around Rs 3,250 levels and thereafter saw a breakout at Rs 3,450 levels. The retraced level of Rs 3,358, also indicated a support level.
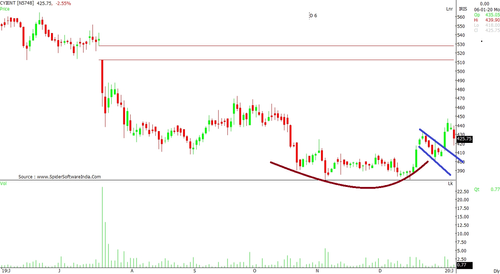
3. Cyient (CYIENT)
A bigger formation showed consolidation with bottom around Rs 380 on several occasions. The counter crossed the upper side resistance of consolidation and retraced downward before breaking trend line at Rs 410 levels. The counter broke out with strong volumes.
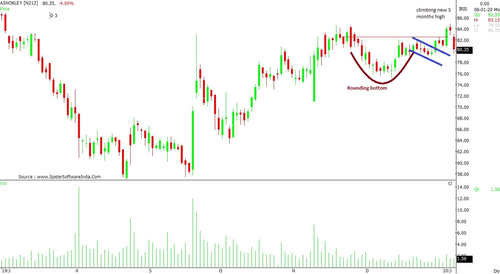
4. Ashok Leyland (ASHOKLEY)
The rounding bottom formation in the range of Rs 76 - Rs 75 broke out above Rs 81. The counter witnessed continuous selling pressure/ resistance around Rs 82.50 levels. A strong rally was seen when the counter crossed the resistance level and climbed to new five-month peak.
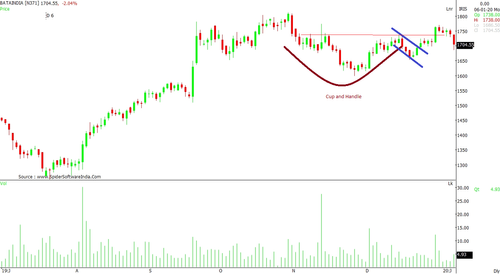
5. Bata India (BATAINDIA)
A rounding bottom formation that started from Rs 1,750 level, hit a low of Rs 1,600 and ended towards Rs 1,737, resulting in an upside towards Rs 1,800 levels. A trend line breakout at Rs 1,700 suggested a positive prospect. The volumes remained sideways during the breakout, still the price managed to move higher.