

Here's How You Can Identify Entry And Exit Points In Trading For Max Profit
- 4m•
- 2,379•
- 21 Apr 2023
The entry and exit levels play a crucial role in the success of a trade. And as such, no trading strategy can be built without a proper entry and exit model. To ascertain these crucial points, one needs to be well-versed with all the tools, indicators, and time frames of technical analysis so that one can develop his/her own remote model that should be able to achieve over 80 per cent accuracy.
Nowadays, several technical analysis software provide inbuilt strategies and models that one can use while taking a trade. However, the best way to be profitable in trading is to develop your own model as there will be many occasions like international markets movement, natural calamities, uncertain corporate development/ results that are not fully discounted by these software. In such cases, human intervention helps incorporate the impact of uncertain developments in technical analysis.
How To Determine The Entry Point In The Simplest Way?
A technical breakout can be a profitable entry point if the trend is studied accurately. This could be derived from the chart and candlestick patterns. One way to eliminate the noise is to wait for the price to settle after the breakout. Secondly, if the breakout has an extraordinary surge in volume, then wait for the price to show corrective moves.
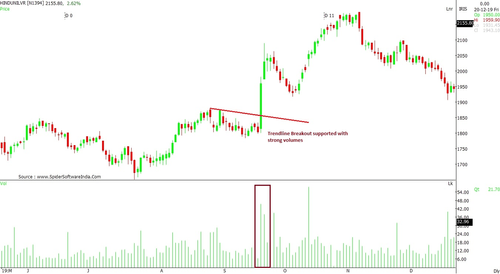
On occasions, one might be too eager in entering a trade on trendline breakout. However, identifying a perfect trendline breakout requires years of experience. In a trendline breakout, a massive surge in volume (SEE HUL CHART) confirms a major positive upside that can push the price over 10 per cent higher in a short span of time.
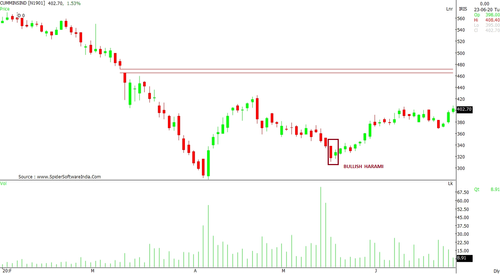
In terms of moving average crossovers, the entry point can be identified on candlestick pattern. A Bullish Harami (SEE CUMMINS CHART), Marubuzo, Morning Star, etc all facilitate in identifying an entry level, which is above their respective candle high.
The basic idea is to confirm a trend before an entry. This is possible if we correlate the time frames. When looking for intraday entry, it is always wise to look at the daily chart and then the weekly chart. Enter a trade wherein the daily and weekly both have positive signals.
Exit A Trade, With Targeted Profit Or Trailed Stop Loss
As the chart patterns have defined targets, which are basically the difference of neckline and the low of the pattern, one can look for higher gains by keeping a trailing stop loss. The exit strategy can be implemented when a particular stock or an index starts witnessing selling pressure above a particular price or range.


