

All You Wanted To Know About Moving Averages In Stock Market Trading
- 4m•
- 1,156•
- 20 Apr 2023
Whenever the stock price shows a reversal near the major moving averages, the turnaround is expected to be sharp, and the volumes tend to increase.
Moving average is a mean of a particular trading session, or multiple sessions, which helps investors understand the broad outlook of an index/stock. The mean displays the strength or weakness. The stocks trading above the mean are classified as bullish and the ones trading below the mean as bearish.
While this isn't the only information one needs in order to make an informed decision, it definitely is one of the most crucial components of any trading model. Moving averages help investors understand the price movement over a given period. They highlight the volatility and swings within a trend, which need to be clearly monitored and analysed in order to understand the market sentiment and the expected next move.
Analysing Moving Averages
Moving averages also act as support and resistance in technical analysis. In a trending market, the stock or index always moves higher after taking support of the well-moving averages, like 50-DMA. This shows that the market breadth is in favor of the bulls.
When the price witnesses strong resistance near any moving average, this depicts selling pressure and market participants are waiting to capitalize every upside opportunity to form short positions. The crossing or breaking of moving average levels are crucial events that encourage market participants to take an aggressive position in the respective direction.
Another important component is the crossover of moving averages. When a small moving average crosses above a bigger moving average, it indicates a positive shift in the trend and the stock price is expected to scale higher levels.
Commonly Used Averages
In general, three major moving averages -- 50-DMA, 100-DMA, and 200-DMA -- are considered in the stock market. A bullish outlook is when a small average crosses above a bigger average, which is termed as “Golden Cross” and the opposite is named as “Death Cross”, which usually depicts weakness and bearish sentiment
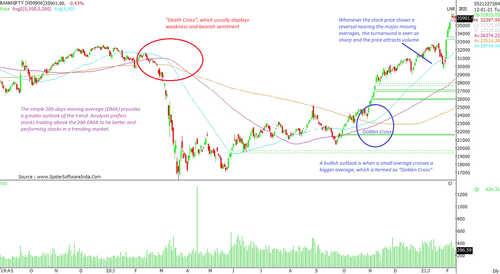
Whenever the stock price shows a reversal near the major moving averages, the turnaround is expected to be sharp, and the volumes tend to increase. This turnaround in sentiment provides opportunities for traders, especially in derivative markets.
For long-term investors, the simple 200-day moving average (DMA) provides a broad outlook of the trend. Analysts prefer stocks trading above the 200-DMA, since they tend to perform better in a trending market. Risk management, hence, becomes comparatively easier with allocation of stocks trading well above their respective 200-DMA levels.
The reason stocks fail to regain/continue momentum after slipping below their respective moving averages is due to the change in sentiment to 'bearish'. In such cases, trading or investing becomes risky as the stock fails to re-emerge above the mean. Such stocks may see uncertain moves in downward direction with rise in volatility. And hence, participants generally tend to avoid investing in such stocks.
Few of the most significant technical indicators like Bollinger Band and Moving average convergence divergence (MACD) have been developed on the basis of moving averages. The specific trading signals triggered by these technical indicators are very useful and provide in-depth details about the sentiment and the market breadth.


