Home
Account Login
Not Logged In
☰
  • Trade Now
  • About Us
    • Why Choose us
      • About Kotak Securities
      • Awards and Accolades
      • About Kotak Group
      • Technology
      • Strong Research
      • Ease of Use
      • Service
      • Testimonials
    • Media
      • Press Release
      • Corporate Profile
      • Media Kit
    • Careers
      • NISM Course
      • Current Openings
      • Leadership Speaks
      • Recognition
      • Work Culture
  • Offerings
    • Asset Classes
      • Equity
      • Derivative
      • MF
      • IPO
      • ETF
      • Nifty ETF
      • Currency Derivatives
      • Tax Free Bonds
      • Gold ETF
      • Stock Lending & Borrowing (SLBM)
      • Interest Rate Futures
      • Commodity
    • Trading Tools
      • Website
      • KEAT PRO X
      • Kotak Stock Trader
      • Smallcase
      • Fastlane
      • Xtralite
      • Dealer assisted trading
      • Call and Trade
      • TradeSmart Store
      • TradeSmart Derivatives
      • TradeSmart Insights
      • TradeSmart Trends
      • Chat To Trade
    • Account Types
      • Demat Account
      • EquityTrading Account
      • 2 in 1 Account
      • Trinity Account
      • Linked Account
      • NRI Account
      • Foreign Investors (QFI)
      • PMS
      • Private Client Group (PCG)
      • Pearl Account
    • Brokerage Options
      • Free Intraday Trading
      • Dynamic Brokerage
      • Fixed Brokerage
      • Advance Brokerage
      • NRI Brokerage Plans
      • Shubh Trade
    • Value Added Features
      • Refer and Earn
      • Track External Investments
      • WillSecure
      • Margin Calculator
      • Autoinvest
      • Margin Trading Facility
      • Super Multiple
      • BNST
      • Portfolio Tracker
      • SMS Alerts
      • Indicators and Technical Charts
      • Capital gain report
      • Stock as Margin
      • AMO
  • Markets
    • Market Indices
      • Indian Indices
      • Global Indices
    • Equities
      • Share Market Live
      • Gainer
      • Loser
      • Most Active Stocks
      • Volume Buzzer
      • 52Wk High
      • 52Wk Low
    • Derivatives
      • Derivatives Overview
      • Most Active Contracts
      • Gainers
      • Losers
      • Most Active Put
      • Most Active Call
      • Open Interest
      • Highest in Premium
      • Put Call Ratio
      • Historic Data
    • News
      • All News
      • Bullion News
      • Economic Growth
      • Economy General
      • Other News
    • Currencies
      • FII & DII Activities
      • Event Calendar
      • Announcements
      • Recent Deals
        • Block
        • Bulk
    • Currencies
    • FII & DII Activities
    • Event Calendar
    • Announcements
    • Recent Deals
      • Block
      • Bulk
  • Research
    • Live Research Calls
      • Fundamental Call
      • Technical Call
      • Derivatives Call
      • SIP Call
      • Top Monthly Picks
      • Pick of the Week
      • Consensus
      • Research Success Rate
    • Kotak Research Centre
      • Investors Research
      • Trader Research
      • Mutual Fund Research
      • Nifty Call of the Day
    • Latest Research Reports
      • Buyback
      • Stock Recommendations
      • Trading Recommendations
      • Sector research and updates
      • Market strategy research
      • Derivatives strategy
      • Currency and forex insights
    • Research Events
      • Annual Investor
        Conference 2018
      • Research webinars
    • Sample Research Reports
      • Fundamental
      • Technical
      • Derivatives
      • Currency Derivatives
  • Knowledge Bank
    • Kotak University
    • Union Budget
    • Aadhaar Card
    • Equity Trading
    • Derivative Trading
    • Intraday Trading
    • Mutual Funds
    • Financial Planning
    • Pan Card
    • Voter ID
    • Driving License
    • Income Tax
    • Calculators
    • Videos
    • Meaningful Minutes
    • Articles
  • Help
    • Contact Us
      • Branch Locator
      • Open an Account
      • Activate an account
      • Check Application
        Status
      • FAQs
    • Demos
    • Forms
    • Chat
  • Franchisee
    • Overview
      • Login
      • Partner with us
      • What is a Franchisee?
      • How to become a Franchisee?
      • Broker v/s Sub-Broker
      • Business Models
    • About Us
      • Why Join Us?
      • Partner Success Stories
    • Business Models
      • Business Support
      • Training & Events
      • Tools & Software
    • Contact Us
      • FAQs
Home » Research » Investment Knowledge Bank » What Is Asset and Liability Analysis
Research: Knowledge Bank
  • Kotak Research Center
  • Sample Research Reports
  • Gold Funds
  • Demat Account
  • Currency-Derivatives

Chapter 7.3: What is Asset & Liability Analysis

Now that we have a reasonable understanding of the revenues and expenses of a company, let’s look at the assets it uses to generate these revenues and the liabilities it takes on to finance these assets.

Information on the assets and liabilities of a company can be found in its balance sheet and the notes to it. A balance sheet is a statement that describes the financial position of a company at a given point in time. It is divided into two sections- assets and liabilities. Some companies like to refer to them as ‘uses’ and ‘sources’ of funds. A third section found in the balance sheet is called equity. It contains information regarding the funds a company has raised through the issuance of shares and the portion of its annual earnings that it has retained. Equity is generally combined with liabilities because like debt, it too is a source of funds. The assets of the company are financed by these two sources together. Thus,

Formula of Assets by Kotak Securities

What is assets analysis

An asset is "a resource controlled by the entity (i.e. company) as a result of past events and from which future economic benefits are expected to flow to the entity," according to International Financial Reporting Standards (IFRS) – the globally used standards in accounting.

In other words, anything a company legally owns and which is expected to generate revenue for it in the future is its asset. Assets can be long-term (fixed) or short-term (current), tangibleor intangible, purchased or internally developed. The classification into fixed and current is based on the length of time for which they are expected to provide benefit in future.

This can be illustrated as follows:
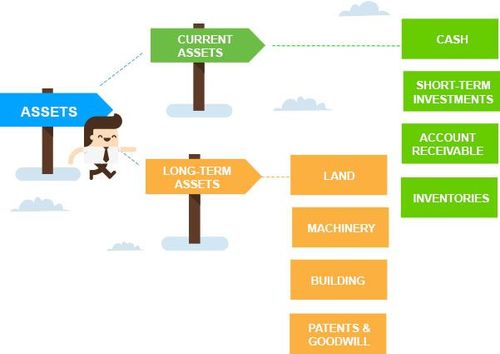
Different Types of Assets

Types of Assets

  • Tangible long-term assets :

    Long-term assets which can be touched and felt, such as land, plant, machinery and equipment fall under this category. They directly help the company in producing goods and services, which it sells to earn revenue. Every year, these assets, with the exception of land, lose a part of their original value owing to wear and tear; and obsolescence.

    This is called depreciation. As the asset gets older and becomes more obsolete, its value falls further.Eventually, it has to be replaced by a new one to keep the company’s earnings potential intact.

    Decisions regarding the age of an asset and depreciation charged on it should therefore form the center of your attention when analyzing long-term assets. Some of the questions you would like to ask in this respect are:

  • What long-lived assets does the company own?
  • How old are these assets?
  • Are they sufficient for the company to achieve its future growth objectives?
  • What will it cost the company to replace these?
  • What are the new assets the company is investing in/developing?
  • What stage of purchase/ development are they in?
  • What new capabilities will the new assets bring to the company?
  • Do they signify a shift towards a new business line/ product?
  • Intangible long-lived assets :

    Companies also own some assets that can neither be touched nor felt. However, they exist and contribute significantly to its income. Such assets are called intangible assets. They include copyrights, patents, trademarks and licenses.

    These assets generally provide benefits over a long period of time and are therefore categorized as long-term assets. Like tangible assets, they too lose value over time.

    Thus, a non-cash, depreciation-like charge, called amortization is annually deducted from their value.

    When assessing intangible assets, your first concern should be determining whether these are actually assets that a company can earn revenue from in the future and if so, what is their value. Although accounting rules are fairly stringent in this respect, there are always doubts regarding the significance and value of such assets.

    This is especially true in case of IT companies, whose products are entirely intangible. Most of their assets are internally developed. Their value cannot be verified because there is no proof of their purchase and no way of demonstrating that they can generate money in future.

    Thus, one must use a lot of judgement in evaluating such assets.

  • Accounts receivable :

    When a company sells its goods on credit, it becomes a liability for its customers. For the company itself, it is an asset because it expects to receive this amount in future. A sum total of all such amounts is recorded in the balance sheet under the name of accounts receivable.

    It is recorded as a current asset because the company hopes it will receive it soon. One statistic that is relevant in this regard is the days of sales outstanding. It measures the number of days it takes, on average, for the company to receive its outstanding revenue. The smaller it is the better for the company.

    In the notes to the balance sheet, companies also give the period for which their receivables have been outstanding. While analyzing accountsreceivable, you should focus on three things:

    Firstly, a steep increase in accounts receivable over the previous year means that the company is not generating enough cash sales, signifying poor earnings quality.

    Secondly, an increase in accounts receivable means that old dues have also not been cleared. This raises the concern as to whether they will be recovered at all.

    Lastly,you should look at the section of the notes to the balance sheet,which talk about the length of time for which receivables have remained outstanding.If most of the receivables have stayed outstanding for long periods, there is something wrong with the recovery mechanism of the company. This is a warning sign for the future.

  • Accounts receivable :

    Other important components assets held by a company are cash, cash equivalents and short term investments in securities, i.e. shares and bonds of other companies.

    They are almost as good as cash because they can be quickly converted into it. If the combined value of these is high, you must be tempted to ask why the company is holding such a large amount of cash and cash equivalents.

  • Does it have investment requirements that need to be financed?
  • Is it a contingency for expenses it expects to come about imminently?

If neither of these is true, the company must distribute this cash to its shareholders in the form of dividends or repurchase of its own shares.

A recent case that comes to mind here is the case of billionaire investor Carl Icahn requesting Apple’s CEO Tim Cook to distribute excess funds worth $164 billion, held in the form of cash and securities, back to the company’s shareholders through a share buyback.

  • Intangible long-lived assets :

    This is another category of current assets. It refers to the goods that are currently lying in storage with the company. They may be in the form of raw material, work-in-progress or finished products. Normally, companies like to hold the smallest possible amount of inventory on its hands. This is because holding inventory entails costs, such as warehousing costs, insurance etc.

    Thus instead of carrying inventory, companies try to organize their production processes such that raw materials arrive just in time for production to begin and goods are ready just in time for delivery. Even so, some industries require holding large amounts of inventory. In other cases, goods may be of a perishable nature. Thus, a large inventory cannot be maintained.Generally speaking, you should look at companies with large inventories with skepticism.

    The principal concerns when analyzing inventories should be on the relationship between inventories and sales; and the nature of goods held in the inventory.If the growth in inventories is greater than the growth in sales, it suggests that the company is struggling to sell its products and inventories are building up. This is worse In case of perishable goods, as it could mean the entire lot
    getting spoilt.

    Companies that are performing well will typically have a high proportion of their inventories in the form of raw material and only a small proportion in the form of finished goods. This is so because finished goods are selling fast and the company has to keep raw material on hand to continuously produce more.

    The reverse is true of companies with a majority of their inventory comprising of finished goods. This indicates a slowdown in the sales, leading to accumulation of finished products and a slowdown in the purchase of fresh raw material.

Understanding liabilities analysis :

Before you conduct liabilities analysis, let us understand what forms a company’s liabilities in the first place.
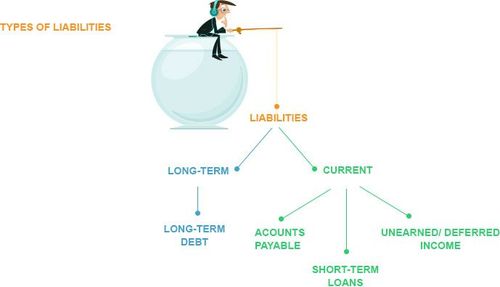
Different Types of Liabilities

  • Long term debt :

    This component primarily refers to the debt a company raises in the form of bank loans and bonds to finance the purchase/ construction of a fixed asset. Sometimes these funds are also raised when a company wants to acquire another company. The terms and conditions of the lender are mentioned in a document called indenture. It also specifies certain dos and don’ts for the company. These are called indentures.

    The reason why analyzing debt should interest you is because the annual earnings of a company are first used to pay the interest and principal due for the year. Only then are shareholders like you paid dividend. Also, if a company goes bust, lenders are paid before anything can be paid to investors. Higher the proportion of debt, higher will be the shareholders’ risk. You must, therefore, ensure that the company has adequate means to repay its debt. Investors often use coverage ratios to make this assessment.

    Additionally, some questions they like to ask are:

  • How much debt does the company have?
  • By when does the company expect to repay its debt?
  • What restrictions does the indenture impose on the company?
  • What does it plan to invest the money on?
  • By when will be asset become usable and start generating revenue?
  • Will the asset generate enough revenue to repay these debts?
  • What are the risks involved?
  • Accounts payable :

    Company’s purchase a variety of inputs for the production of their goods. However, they don’t always pay the suppliers upfront.The accumulation of all such outstanding payments is called accounts payable. It is a current liability as the company expects to fulfill it in the short term.

    An accumulation of accounts payable, matched with an increasein sales suggests that the company enjoys favorable terms with its suppliers. A statistic commonly used to assess this is thenumber of days of payables. It measures the average number of days it takes for a company to pay its suppliers. You want this number to be higher than days of sales outstanding (mentioned earlier) because it would mean the company receives its money from its customers before it has to pay its suppliers.

    In the contrary situation, the company will have to borrow money to pay its suppliers while its revenues arrive.

  • Short term debt and other current liabilities :

    This includes things like short term loans, note payable and deferred income (i.e. income received in lieu of obligations the company will fulfill in future).

    These are sources that are expected to finance the current assets of the company. As such, you should ideally expect their value to be greater than the current assets of the company. The difference between the two is called working capital. It has been discussed in detail below.

Working capital analysis

Equity analysis is based on the concept of matching. Liabilities finance the acquisition of assets. Therefore, long-term assets must be matched off against long-term liabilities and current assets against current liabilities. To see if the later holds, you can use a variable
called working capital.

Formula of Working Capital by Kotak Securities

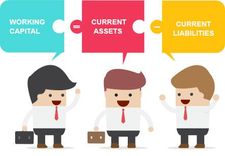
It matches off short-term assets (with certain exceptions) against short-term liabilities (with certain exceptions). Normally, the value of working capital should be moderate. The value will be high if there is a huge surplus of current assets over current liabilities. This means the company is investing more in short term assets than its short term funds permit.

The rest are therefore being financed through long-term debt. This is not sustainable. In case the surplus of current liabilities is significant, it means that the company is unproductively holding a large amount of funds. It could have either chosen to not acquire such a large amount of current liabilities or use it for more productive purposes (even pay an extra dividend to investors). In either case, it reflects poorly on the company’s efficiency and short term financial health.

Alternatively, a company may be bracing itself for a massive outflow of short-term funds. Notes to the balance sheet should clarify this.

What next?

With the analysis of assets and liabilities, we complete our understanding of the two major financial statements. Next, we round off our conversation on fundamental analysis by contrasting it with technical analysis and reviewing its strengths and limitations. click here.

Revenue & Expense Analysis Financial Statement Analysis Intrinsic Value of Stocks
Fundamental Analysis of Indian Stocks
What is Accounting Understanding Stock Market Trends
Fundamental and Technical Analysis Cash flow Statement How to Identify Market Trends
Perform Fundamental Analysis of Stocks Balance Sheets Stock Charts in Technical Analysis
Fundamentals of Industry Analysis Relation between Stock Price and Dividends How to Read Stock Charts
Business Models Income Statements Intraday Trading Guide for Beginners
Fundamentals of a Company Company Annual Reports Difference Between Intraday and Delivery Trading
Stakeholder Rights Stock Valuations through Financial Ratios How to choose stocks for intraday trading
How Companies and Industries Work Introduction to Technical Analysis of Stocks Intraday Trading Tips
Fundamentals of Stocks Technical Analysis Intraday Indicators and Techniques Cost of Intraday Trading
Previous Chapter Next Chapter
Trading Demos
  • Mobile Trading with Kotak Stock Trader View Demo
  • Desktop Trading with KEAT ProX View Demo
2014661828285397187587
Open your Demat Account Today
How it helps
  • Use existing bank account
  • Convenience through partnerships
  • Kotak Securities support


Stock Market Sectors :        A | B | C | D | E | F | G | H | I | J | L | M | N | O | P | R | S | T | V | W |

About Us

  • • Branch Locator
  • • About Kotak Securities
  • • Awards and Accolades
  • • About Kotak Group
  • • Technology
  • • Strong Research
  • • Customer Support Chat
  • • Brokerage Charges

Asset Classes

  • • Equity Trading
  • • Derivative Trading
  • • Mutual Fund Investment
  • • IPO
  • • Gold Funds
  • • Currency Derivatives
  • • Fixed Deposits & Tax Free Bonds
  • • Debentures

Derivatives Market

  • • Most Active Contracts
  • • Gainers
  • • Losers
  • • Top Volume Traded
  • • Top Value Traded
  • • Most Active Put
  • • Most Active Call
  • • Open Interest
  • • Highest in Premium
  • • Put Call Ratio

Investment Knowledge Bank

  • • Share Market Basics
  • • What is Demat Account
  • • What are Derivatives?
  • • What are Futures?
  • • What are Options?
  • • What are Mutual Funds?
  • • Basics of Financial Planning
  • • Calculators
  • • Videos
  • • Meaningful Minutes

Trading Tools & Research Reports

  • • KEAT PRO X
  • • Kotak Stock Trader APP
  • • Fastlane
  • • Xtralite
  • • Dealer assisted trading
  • • Call and Trade
  • • Investors Research
  • • Trader Research
  • • Mutual Fund Research
  • • Fundamental Analysis Reports
  • • Technical Analysis Reports
  • • Derivative Reports
  • • Currency Derivative Reports

Account Types & Value Added Services

  • • Demat Account
  • • 2 in 1 Account
  • • Trinity Account (3-in-1 Account)
  • • Linked Account
  • • NRI Account
  • • PMS
  • • Margin Trading
  • • BNST
  • • TradeSmart Store
  • • SMS Alerts
  • • AMO

Equity Market

  • • Share Market Live
  • • Gainer
  • • Loser
  • • Most Active Stocks
  • • Volume Buzzer
  • • 52Wk High
  • • 52Wk Low
  • • All Market News
  • • Bullion News
  • • Economy General
  • • Corporate Actions
  • • Other News
CUSTOMER CARE TOLL FREE

1800 209 9191 / 1860 266 9191

Mon to Fri – 8.00 AM TO 6.00 PM
Sat – 9.00 AM to 2.00 PM
To dial from Mobile phone add city STD code

Existing customers can send in their grievances for Trading account to service.securities@kotak.com
& Demat account to ks.demat@kotak.com

Connect with us

No need to issue cheques by investors while subscribing to IPO. Just write the bank account number and sign in the application form to authorise your bank to make payment in case of allotment. No worries for refund as the money remains in investor's account.

KYC is one time exercise while dealing in securities markets - once KYC is done through a SEBI registered intermediary (broker, DP, Mutual Fund etc.), you need not undergo the same process again when you approach another intermediary. Attention Investors Prevent Unauthorized Transactions in your demat / trading account --> Update your Mobile Number/ email Id with your stock broker / Depository Participant. Receive information of your transactions directly from Exchanges on your mobile / email at the end of day and alerts on your registered mobile for all debits and other important transactions in your demat account directly from NSDL/ CDSL on the same day." - Issued in the interest of investors. Circular No.: NSDL/POLICY/2014/0094, NSE/INSP/27436, BSE - 20140901-21

Kindly note that as per NSE circulars nos: NSE/INVG/36333 dated November 17, 2017, NSE/INVG/37765 dated May 15.2018 and BSE circular nos: 20171117-18 dated November 17, 2017, 20180515-39 dated May 15.2018, trading in securities in which unsolicited messages are being circulated is restricted. The list of such stocks are available on the website of NSE & BSE. In case of any queries, request you to kindly get in touch with Customer Service on 18002099191/9292

Kotak Securities Ltd. bearing licence no. CA0268 is a Corporate Agent of Kotak Mahindra Old Mutual Life Insurance Ltd. We have taken reasonable measures to protect security and confidentiality of the Customer Information.

The Stock Exchange, Mumbai is not in any manner answerable, responsible or liable to any person or persons for any acts of omission or commission, errors, mistakes and/or violation, actual or perceived, by us or our partners, agents, associates etc., of any of the Rules, Regulations, Bye-laws of the Stock Exchange, Mumbai, SEBI Act or any other laws in force from time to time.
The Stock Exchange, Mumbai is not answerable, responsible or liable for any information on this Website or for any services rendered by our employees, our servants, and us.

Filling complaints on SCORES- Easy & Quick

a. Register on SCORES portal  |  b. Mandatory details for filling complaints on SCORES  i. Name, PAN, Address, Mobile Number, E-mail ID  |  c. Benefits:  i. Effective Communication  ii. Speedy redressal of the grievances

Charges for Other Services  |  Disclaimer  |  Sitemap  |  Privacy & Security  |  256 Bit Encryption  |  BSE  |  NSE  |  MSE  |  MCX  |  SEBI  |  SCORES  |  Anti Money Laundering Measures  |  Important Policies  |  Dos & Donts  |  National Pension System  |  List of GST Registration Number

© 2005 Kotak Securities Limited.

Registered Office: 27 BKC, C 27, G Block, Bandra Kurla Complex, Bandra (E), Mumbai 400051. Telephone No.: +22 43360000, Fax No.: +22 67132430.
Correspondence Address: Infinity IT Park, Bldg. No 21, Opp. Film City Road, A K Vaidya Marg, Malad (East), Mumbai 400097. Telephone No: 42856825.

CIN: U99999MH1994PLC134051. SEBI Registration No: INZ000200137(Member of NSE, BSE, MSE, MCX & NCDEX), AMFI ARN 0164, PMS INP000000258 and Research Analyst INH000000586.

NSDL/CDSL: IN-DP-NSDL-23-97

New To share Market?

Open Your Account Today!

New Customer?

Hurry! Sign up for Free Intraday Trading now

BROKERAGE FREE

on intraday trades

AVAIL THE OFFER NOW

NO ACCOUNT OPENING CHARGES


Submit

Please Note

That by submitting the above mentioned details, you are authorising Kotak Securities & its sub-brokers & agents to call you and send promotional communication even though you may be registered under DNC.

Open An Account