• Invest
    Investment Suite
    Stocks
    Mutual Funds
    Future and Options
    IPO
    Exchange Traded Funds
    Commodity
    Stockcase (Stock Baskets)
    Currency
    Non Convertible Debentures
    Sovereign Gold Bond
    Exclusive
    NRI Account
    Private Client Group
    Features
    SipIt
    MTF
    Investment Suite
    Exclusive
    Features
  • Platform
    Product Suite
    Kotak Neo App & Web
    Nest Trading Terminal
    NEO Trade APIs
    Features and Tools
    MTF
    Securities Accepted as Collateral
    Margin Requirements
    Equity Screeners
    Payoff Analyzer
    Calculators
    SIP Calculator
    Lumpsum Calculator
    Brokerage Calculator
    Margin Calculator
    MTF Calculator
    SWP Calculator
    CAGR Calculator
    Simple Interest Calculator
    ELSS Calculator
    Step up SIP Calculator
    All Calculators
    Product Suite
    Features and Tools
    Calculators
  • Pricing
  • Research
    Research Calls
    Long Term calls
    Short Term calls
    Intraday calls
    Derivatives calls
    Pick of the week
    Top Monthly Picks
    Research Reports
    Fundamental Research Report
    Technical Research Report
    Derivative Research Report
    Research Calls
    Research Reports
  • Market
    Stocks
    Market Movers
    Large Cap
    Mid Cap
    Small Cap
    Indices
    Nifty 50
    Bank Nifty
    FinNifty
    Nifty Midcap India
    VIX
    All Indian Indices
    Mutual Funds
    SBI Mutual Funds
    HDFC Mutual Funds
    Axis Mutual Funds
    ICICI Prudential Mutual Funds
    Nippon India Mutual Funds
    All AMC's
    IPO
    Upcoming IPO
    Current IPO
    Closed IPO
    Recently Listed IPO
    Stocks
    Indices
    Mutual Funds
    IPO
  • Learn
    Resource
    Market Ready
    Kotak Insights
    Infographic
    Podcast
    Webinars
    Youtube Channel
    Quarterly Results
    Investing Guide
    Demat Account
    Trading Account
    Share Market
    Intraday Trading
    IPO
    Mutual Funds
    Commodities
    Currency
    Futures & Options
    Derivatives
    Margin Trading
    Events
    Budget 2024
    Muhurat Trading
    Share Market Holiday
    Market Outlook 2025
    Resource
    Investing Guide
    Events
  • Partner
    Business Associates
    Fund Expert
    Kotak Connect Plus
    Startup connect
  • Support
    FAQs
    Circulars
    Bulletins
    Contact Us
    Forms Download
    Get your Statement

Here's Why Moving Averages Are A Must For Your Trading Model

  •  4m
  • 0
  • 19 Apr 2023

One of the simplest techniques to gauge the trend of a stock/market is Moving Average. It is classified as the average value of a security over a specified period. Usually, when the price trades above the average, the trend is considered as bullish and when the price falls below the average, the sentiment is said to be bearish.

There are various moving averages that assist in identifying the sentiment of a stock. The basic and most effective averages are 50-day moving average (50-DMA), 100-DMA, and 200-DMA. The combinations of these moving averages often indicate substantial movement in the stock price.

Intra-day traders consider lower averages (eg: 9-DMA, 13-DMA, 20-DMA) as this helps traders with swing trades wherein they want to capture profits on the day-to-day basis while mitigating risk.

From a broad perspective, the major moving average tracked is the 200-DMA. Securities trading above or crossing 200-DMA on the monthly chart attract attention from even investors, resulting in a steady up trend that later on builds follow-up buying.

As the average is arrived on the basis of past data points using a mathematical formula, it assists in filtering out the ‘noise’ and attempts to provide a smooth and clear view on the securities.

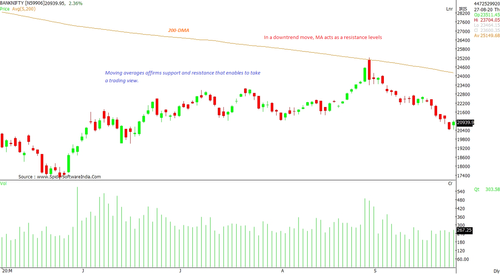
Moving averages affirm support and resistance that enable one to take a trading view

The intersection of moving averages helps one acknowledge the shift in sentiment.

In trending markets, MAs help one understand the corrective support levels

In a downtrend move, moving averages act as resistance levels. (Nifty Bank chart)
There are two types of moving averages: Simple moving average (SMA) and Exponential moving average (EMA). The SMA gives equal weightage to all the data points; while, EMA applies more weight to the recent data. The EMA facilitates trading when one is attempting to make swing profits, or quick trades, as it reflects change in move rather quickly. Whenever the stock breaks out above the hurdle, the EMA provides a swift signal.

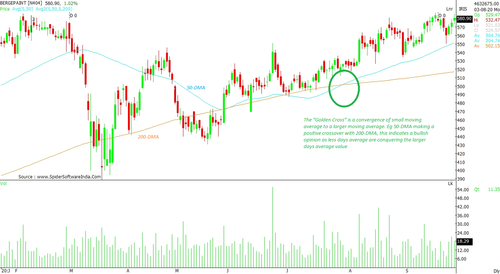
The crossover of moving averages is commonly recognized as a trading signal. This reflects the change in sentiment which inevitably impacts the price. The 'Golden Cross' is a crossing of small moving average with a larger moving average. eg 50-DMA making a positive crossover with 200-DMA, which indicates a bullish outlook as the shorter moving average is conquering the longer moving average value. Likewise, 'Death cross' gives a negative outlook with the 200-DMA crossing the 50-DMA negatively, suggesting a bearish mood going forward. (Berger paint chart)
Did you enjoy this article?

0 people liked this article.

What could we have done to make this article better?

Read Full Article >
Enjoy Free Demat Account Opening
+91 -

personImage
Enjoy Free Demat Account Opening
+91 -

N
N
[object Object]
[object Object]
[object Object]
[object Object]
[object Object]
[object Object]
[object Object]
[object Object]
[object Object]
[object Object]
[object Object]
[object Object]
[object Object]
[object Object]
[object Object]
[object Object]
[object Object]
[object Object]
[object Object]
[object Object]
[object Object]
[object Object]