• Invest
    Investment Suite
    Stocks
    Mutual Funds
    Future and Options
    IPO
    Exchange Traded Funds
    Commodity
    Stockcase (Stock Baskets)
    Currency
    Non Convertible Debentures
    Sovereign Gold Bond
    Exclusive
    NRI Account
    Private Client Group
    Features
    SipIt
    MTF
    Investment Suite
    Exclusive
    Features
  • Platform
    Product Suite
    Kotak Neo App & Web
    Nest Trading Terminal
    NEO Trade APIs
    Features and Tools
    MTF
    Securities Accepted as Collateral
    Margin Requirements
    Equity Screeners
    Payoff Analyzer
    Calculators
    SIP Calculator
    Lumpsum Calculator
    Brokerage Calculator
    Margin Calculator
    MTF Calculator
    SWP Calculator
    CAGR Calculator
    Simple Interest Calculator
    ELSS Calculator
    Step up SIP Calculator
    All Calculators
    Product Suite
    Features and Tools
    Calculators
  • Pricing
  • Research
    Research Calls
    Long Term calls
    Short Term calls
    Intraday calls
    Derivatives calls
    Pick of the week
    Top Monthly Picks
    Research Reports
    Fundamental Research Report
    Technical Research Report
    Derivative Research Report
    Research Calls
    Research Reports
  • Market
    Stocks
    Market Movers
    Large Cap
    Mid Cap
    Small Cap
    Indices
    Nifty 50
    Bank Nifty
    FinNifty
    Nifty Midcap India
    VIX
    All Indian Indices
    Mutual Funds
    SBI Mutual Funds
    HDFC Mutual Funds
    Axis Mutual Funds
    ICICI Prudential Mutual Funds
    Nippon India Mutual Funds
    All AMC's
    IPO
    Upcoming IPO
    Current IPO
    Closed IPO
    Recently Listed IPO
    Stocks
    Indices
    Mutual Funds
    IPO
  • Learn
    Resource
    Market Ready
    Kotak Insights
    Infographic
    Podcast
    Webinars
    Youtube Channel
    Quarterly Results
    Investing Guide
    Demat Account
    Trading Account
    Share Market
    Intraday Trading
    IPO
    Mutual Funds
    Commodities
    Currency
    Futures & Options
    Derivatives
    Margin Trading
    Events
    Budget 2024
    Muhurat Trading
    Share Market Holiday
    Market Outlook 2025
    Resource
    Investing Guide
    Events
  • Partner
    Business Associates
    Fund Expert
    Kotak Connect Plus
    Startup connect
  • Support
    FAQs
    Circulars
    Bulletins
    Contact Us
    Forms Download
    Get your Statement

What Are Moving Averages And How To Use Them To Make Money In Stocks

  •  3m
  • 0
  • 17 Apr 2023

Moving Average is an indicator that helps avoid the uncertain price fluctuations. It acts as an instrument to smoothen the significance of the price to determine the trend. It does lag in some cases, however, the overall scenario helps define the direction.

The prime application of Moving Average is to find the direction of the trend, but it also identifies support and resistance levels. When co-related with other technical indicators like Relative Strength Index (RSI) and Moving Average Convergence Divergence (MACD), it provides assistance in gauging buy/sell signals.

From an arithmetic perspective, it calculates the mean of a security over a defined number of periods. The major moving averages are 50, 100, and 200, which are classified as short-term, medium-term, and long-term averages, respectively.

Moving average is mostly used with time series data to smooth out short-term fluctuations and highlight longer-term trends or cycles. In other words, traders and investors acknowledge moving averages as a tool to determine positive and negative trends. When an instrument trades above the moving average, the trend seems to be positive and vice versa. Also, when the moving averages makes a crossover, the trend sets to gain strong momentum.

Moving averages lag behind the current prices as they are based on historical data. Hence, the longer the time period for the moving average, the greater the lag. A 200-DMA will have a much greater degree of lag than a 20-DMA, as it will have the price action for the past 200 days.

The length of the moving average to use depends on the trading objectives. Shorter moving averages are used for short-term trading and longer-term moving averages more suited for long-term investors who wish to buy and hold on to a stock.

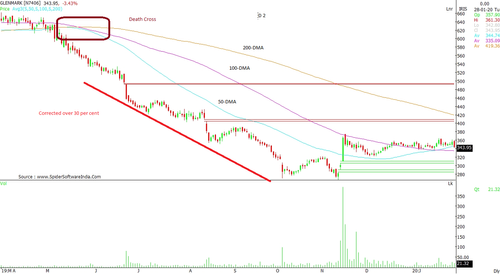
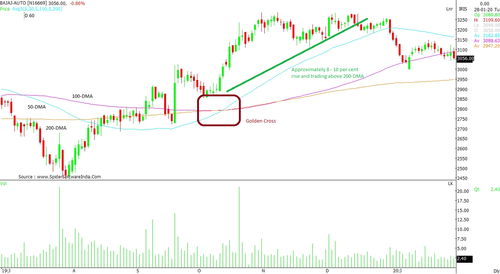
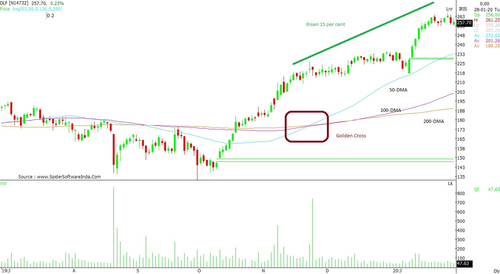
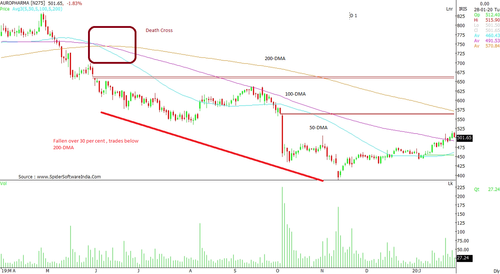
A positive crossover is named as a 'Golden Cross' and a negative crossover as a 'Death Cross'. As per the moving averages, when a security attains Golden Cross, a minimum of 10 per cent jump can be easily achieved. When these three moving averages (50,100,200) make a closer crossover, then the rally may even take the stock 20 per cent higher.

Golden Cross Stocks:

Bajaj Auto Ltd, DLF Ltd, Jubilant Foodworks Ltd, Max Financial Services Ltd., NMDC Ltd, Reliance Industries Ltd, Tata Chemicals Ltd.
Death Cross Stocks:

Aurobindo Pharma Ltd., Glenmark Pharmaceuticals Ltd.
Did you enjoy this article?

0 people liked this article.

What could we have done to make this article better?

Read Full Article >
Enjoy Free Demat Account Opening
+91 -

personImage
Enjoy Free Demat Account Opening
+91 -

N
N
[object Object]
[object Object]
[object Object]
[object Object]
[object Object]
[object Object]
[object Object]
[object Object]
[object Object]
[object Object]
[object Object]
[object Object]
[object Object]
[object Object]
[object Object]
[object Object]
[object Object]
[object Object]
[object Object]
[object Object]
[object Object]
[object Object]