Gravestone, Dragonfly: Use Doji Candlestick Patterns To Maximise Profits
- 4m•
- 1,593•
- 21 Apr 2023
A Doji candlestick is formed when the open and close prices of a stock or index are nearly the same, which represents indecision among traders. The different forms of a doji candlestick are: long-legged doji, Gravestone doji, and Dragonfly doji.
In simple terms, such a candle indicates that the bulls and bears are uncertain about the trend. The strength and momentum for both seems to be at par, resulting in the price settling at the equal level. One can use this candle to make a buy or sell decision.
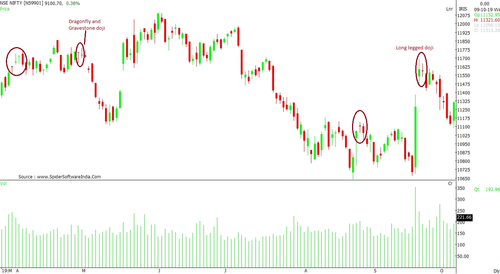
If the immediate session closes on a positive note, then the doji is described as a positive indicator and vice versa. See Chart below:

Types Of Doji Candlestick Patterns
1. Long-legged Doji
This candlestick has a long upper and lower shadow with both the opening and closing prices near the half-way mark. If this candlestick appears on the chart, one can expect the market to move towards a consolidation phase before breaking out in either direction. This candlestick is usually seen during a strong uptrend or downtrend signalling the reversal may emerge if the bulls / bears start exhibiting exhaustion in near term. This also raises concern over the trend's strength. If the trend witnesses slower growth, then this may be an indication of a shift in investor sentiment.
2. Gravestone Doji
This candlestick gives a bearish signal. It demonstrates that the bears gained momentum by the session's close and erased the day's entire gain. This is another indicator for traders to start looking for profit-booking. Although gravestone doji can appear in any scenario, it is most efficient when it occurs at the top of the upward trend. Short-sellers look for such a candlestick to enter the market.
3. Dragonfly Doji
The exact opposite of a Gravestone doji, a Dragonfly Doji candlestick suggests a bullish view with prices regaining the upward momentum at the end of a session. Herein, we can see a long lower shadow exhibiting selling exhaustion. One can gauge a positive reversal if the pattern emerges at the downward trend. If the immediate candle gives a positive close, then the upward move is believed to have a confirmation.
Things to keep in mind while considering a trade on Doji candlestick:-
-
Better the confirmation, stronger the view. It is wise to wait for the next session to give an appropriate confirmation. A green close suggests upward rally and a red close indicates weakness.
-
Dragonfly Doji, if supported by strong rising volumes, can result in a reversal trend that possesses a strong underlying strength.
-
Gravestone Doji is a bearish indicator on the uptrend. That said, it's better to avoid this pattern during consolidation and a downtrend.
-
Doji assists in giving a breakout on chart patterns like Head and Shoulder, double bottom, rising channels, etc.
-
Any support or resistance levels close to Doji candlestick accentuates their relevance.
-
Doji reversal indicates a potential turn-around for a week to a month's time.


