What Is Elliott Wave Theory And How Can You Benefit From It?
- 3m•
- 1,794•
- 14 Aug 2023
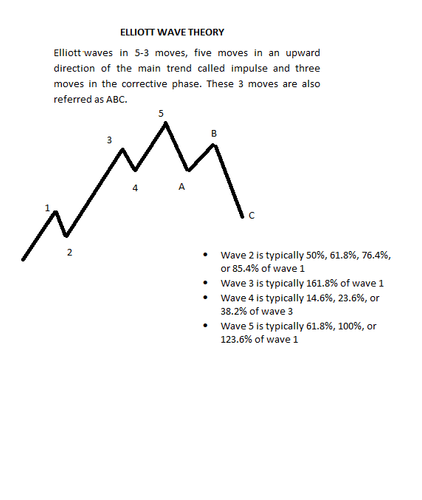
One of the most renowned theories in technical analysis is “Elliott Wave Theory”, which was developed by Ralph Nelson Elliot. This theory speaks about Waves (patterns). Elliot believed that the mass psychology depicts the same recurring patterns in the financial markets. He speaks about waves in 5-3 moves, wherein five waves move in an upward direction of the main trend, known as impulse and three waves move in the corrective phase. These 3 moves are also referred to as ABC.
This theory helps in gauging the upward trend and the correction that are likely to happen in the near future. As the trend shows upside and correction, the identification of trend through Elliott Wave Theory helps in protecting profit and exiting trades.
The theory establishes nine degree of waves from smallest to largest, described as Grand Supercycle, Supercycle, Cycle, Primary, Intermediate, Minor, Minute, Minuette, Sub-Minuette
How To Calculate Elliott Wave
Elliott recognises Fibonnaci sequence, which facilitates in determining the impulse and corrective wave. Fibonnaci retracement identifies areas of support and resistance by plotting a horizontal line based on the prior move. The basic retracements are classified as 23.6%, 38.2%, 50%, 61.8% and 78.6%. The indicator helps as it considers the high and the low of the respective move to draw necessary retracements.
The calculation of the Elliott waves is determined by Fibonnaci as mentioned below -
- Wave 2 is typically 50%, 61.8%, 76.4%, or 85.4% of wave 1
- Wave 3 is typically 161.8% of wave 1
- Wave 4 is typically 14.6%, 23.6%, or 38.2% of wave 3
- Wave 5 is typically 61.8%, 100%, or 123.6% of wave 1

Benefits Of Elliott Wave Theory
Predict the market trend on the basis of wave patterns;
Opportunities on either side of the trend. Even corrective moves can be identified;
A long-term investment can be successfully booked based on the defined price target shown by 5th wave of the Elliott wave theory;
It assists in recognising the market sentiment;
Technical formation such as Double top, Triple top, and Head and shoulder can be determined with Elliott wave.


