

How To Ascertain A Stock Or The Market Is Close To Bottoming Out?
- 4m•
- 1,061•
- 20 Apr 2023
Stock markets around the globe have had a painful start to 2020. Already slowing growth on account of trade wars were jolted by the sudden spread of coronavirus that further dented economic growth. The start bas been the worst since 2011.
On a year-to-date basis, the benchmark Nifty is down around 14 per cent. Last time, it had dropped more during the period under consideration was in 2011, when the European debt crisis had dampened global investor sentiment. The index is down nearly 10 per cent from its record high of 12,352 on January 17.
Global markets, too, have been rattled in recent weeks by the rapidly spreading coronavirus, which has caused widespread supply chain disruption, hobbled the travel industry and prompted drastic containment measures in Italy and elsewhere.
That said, identifying the bottom of any correction is difficult. While the volatility has always remained high, investors at times, have confused the change in trend, especially when the markets are bottoming out, with a dead cat bounce.
Here are three key components that will help you identify the trend and ascertain with fair accuracy that the markets are likely to bottom out.
Consolidation:
Whenever a stock or an index starts trading in a range, the price is said to have formed clear support/resistance levels. A breach on the upside after this consolidation marks the beginning of an upward rally and vice versa.
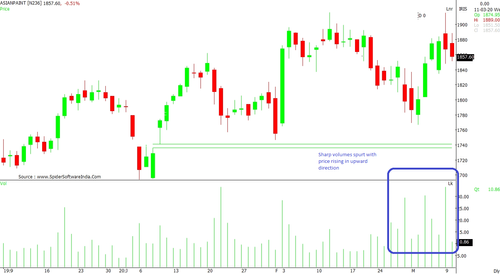
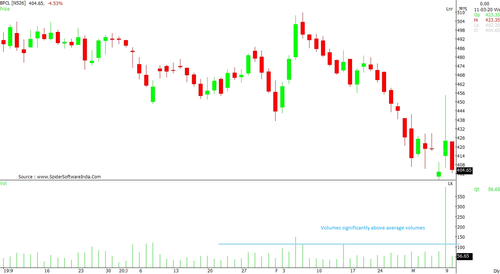
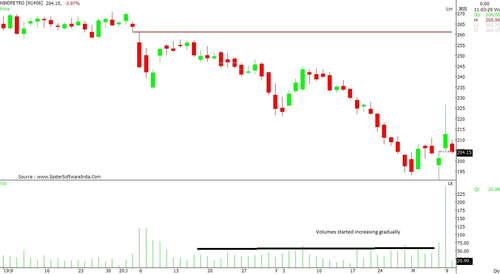
Volumes:
Volumes play a crucial role in determining a trend. Whether the rally is upward or downward, till the volumes don’t coincide with the movement, it is difficult to say how the index or the stock will behave in the days ahead on a sustainable basis. For a clear trend to be established, either the volumes have to be rising or be stable enough for at least couple of sessions for the prices to break out on either side. Ideally, two – three sessions are considered to form a view as regards volumes and the likely trend. (See charts for a better understanding of a rise in volume)
Candlestick patterns:
Few basic candlestick patterns like Doji, Hammer, Morning Star and Bullish engulfing suggest a change in a downward trend. These patterns, when co-related with any technical indicators like Relative Strength Index (RSI), Moving Average Convergence Divergence (MACD) or Moving Averages, assist in determining the reversal.
Application Of These Three Components
The basic idea is to determine the change in trend. This may be accomplished by correlating all these components to get strong confirmation. In any given case, these studies have shown implications wherein the risk-reward ratio seems favorable. Even the volatility gets acknowledged / taken care of in these three components while establishing a trend.


