Here's How To Read And Use The Standard Deviation Indicator In Tradings
- 3m•
- 4,617•
- 20 Apr 2023
Standard Deviation measures the volatility of securities. It is computed as the square root of variance with respect to the mean price. In simple language, it helps one identify the spread or deviation of a price from the mean by considering the historical price data. Higher Standard Deviation means the price has deviated considerably from the mean price, while lower deviation signifies minor variation from the mean.
Generally, blue-chip / large-cap stocks have a lower Standard Deviation compared to illiquid or small-cap stocks. When it comes to choosing a risky investment, market participants opt for stocks with higher standard deviation that provides volatility, which can be used for quick profits. As such, deviation is a key aspect of fundamental analysis, which determines risks involved in various stocks, funds, and other assists.
Key aspects
-
Standard Deviation can assist in determining the target price of a security.
-
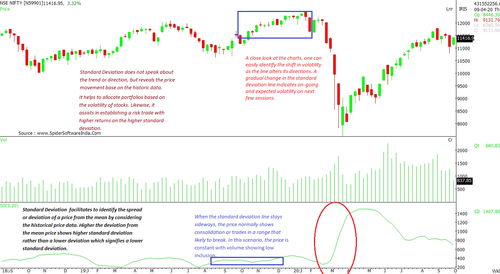
Standard Deviation does not identify the trend or direction, but reveals the price movement based on the historical data.
-
Sometimes, Standard Deviation may provide misleading information, due to unexpected developments regarding the company.
-
It helps to allocate portfolios based on the volatility of stocks. Likewise, it assists in establishing a risk trade with higher returns on the higher standard deviation.
-
When a Standard Deviation starts showing exponential rise, one can assume the existence of higher volatility.
-
Standard Deviation in coordination with other indicators is more useful than focusing on it as the sole indicator.
-
Standard Deviation is unlikely to contribute majorly in intra-day strategies or day trading sessions. Nevertheless, a generalist view may provide minor inputs.
How To Read Standard Deviation On Charts
Standard Deviation does not deliver any trend signals. Rather, it is an instrument that measures and understands volatility and deviations. With a close look at the charts, one can easily identify the shift in volatility as the line alters its direction. A gradual change in the Standard Deviation line indicates the on-going and expected volatility for the next few sessions. (Nifty 50 charts)

When the standard deviation line stays sideways, the price normally shows consolidation or trades in a range that is likely to break. In this scenario, the price is constant with volume showing low participation.
Likewise, when the Standard Deviation on charts shows a gradual rise for several sessions, it is likely to witness higher volatility.
When combined with other momentum indicators like Moving Average Convergence Divergence (MACD) Relative Strength Index (RSI) or price indicators like Bollinger band, moving averages, candlestick pattern, chart pattern, the standard deviation has shown a strong relationship with the Bollinger Band and chart patterns. One can pre-empt the price move to conquer the upper band of Bollinger having strong volatility with standard deviation.
Similarly, if the breakout on chart patterns witnesses sideways trend on standard deviation, the breakout or breakdown is likely to see normal volatility. Whereas, a higher standard deviation in the formation of any chart patterns signals even more volatility on trend confirmation of the breakout.


