

All You Wanted To Know About The Average Directional Index In Trading
- 4m•
- 1,265•
- 13 Apr 2023
The Average Directional Index (ADX) helps one understand the strength of a trend. It is a momentum indicator that is derived from the moving average of the 14-day period. It is well supported by two other indicators -- Positive Directional Indicator (+D) and the Negative Directional Indicator (-D) that are derived from moving averages and true range. The ADX is read on the scale of 0-100; ADX trading above 25 value is considered as a bullish signal and below 25 as negative strength.
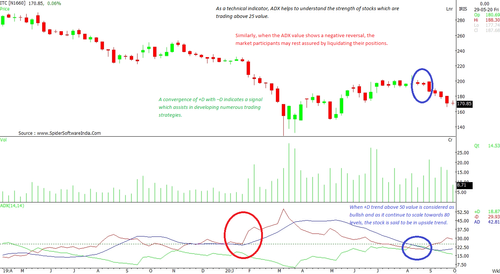
The ADX determines the strength of a trend, whereas the +D and –D identify the trend direction. The crossover of +D and –D provides signals for trading and understanding the overall movement. When +D makes a positive crossover, it is believed to possess an upward direction, whereas the negative crossover reflects downward weakness. When +D trends above the 50 value, it is considered as bullish and as it continues to scale towards the 80 levels, the stock is said to be in an upward trend. (ITC chart)
This indicator was designed by Welles Wilder for commodity daily charts, but has been successfully used in other markets as well. Several market participants have got accustomed to using the indicators in equity markets with signals providing accuracy on the longer term charts. The short-term view is relatively highly unpredictable with high volatility disturbing the price move and, indeed, the direction.
What Does The ADX Tell You?
-
As a technical indicator, ADX helps one understand the strength of stocks which are trading above 25 value.
-
A convergence of +D with –D indicates a signal which assists in developing numerous trading strategies. For example, if the +D line crosses above the -D line and the ADX is above 20, or ideally above 25, then that is a potential signal to buy.
-
ADX ascertains a bullish trend on a bigger time frame more accurately, particularly when the price is about to scale the 25 value.
-
Similarly, when the ADX value shows a negative reversal, the market participants should ideally liquidate their positions.
-
Avoid averaging a stock under 25 value on ADX.
-
With the support of ADX, other indicators exhibit clearer trading signals.
-
Identifying a short-term trend on ADX might be a bit tricky as the perfect signal may be inclusive of the violent price swings and extreme volatility
How To Take Optimum Advantage Of The ADX Indicator?
Although the ADX indicator possesses the capability to identify the trend strength, it is fairly difficult to fully understand this indicator; one needs a lot of experience and numerous strategies to truly unveil the secrets of the ADX indicator.
Crossovers can occur frequently and traders can lose money on trades that can quickly go the other way. Such crossovers are false signals and happen when ADX values are below 25. That said, sometimes the ADX reaches above 25, but is only there temporarily and then reverses along with the price. It takes a seasoned trader to escape these false sinals.
To avoid such tedious work, market participants use ADX in conjunction with other indicators like Relative Strength Index (RSI), The Moving Average Convergence Divergence (MACD), Stochastic, etc. This enables them to optimise the trading signals dispensed by the ADX. The ADX indicator also helps one identify the shift in price through a correlation with various moving averages, candlestick patterns, chart patterns and Bollinger Band.


