

Five Basic Tools To Spot Bearish Reversals Or Downtrend In Trading
- 4m•
- 1,251•
- 21 Apr 2023
Markets move in waves, thus forming peaks and troughs. From a long-term perspective, corrective moves are said to be healthier and effective for a smoother trend. While one can capitalise on an upward rally by going long, identifying corrective moves can help in booking profits and entering short trades.
Over the past few sessions, the markets have been spooked by coronavirus fears. Earlier this week, fears that the coronavirus outbreak in China will grow into a pandemic with disruptive and deadly consequences for countries across the globe spooked most equity markets. The virus, which has killed over 2,400 people in China, has reportedly spread to 28 other countries now.
On Monday, Nikkei futures tumbled 2.7 per cent, EuroStoxx 50 futures declined about 2 per cent while futures for London’s FTSE skidded 1.3 per cent. Asian shares were also a sea of red. Back home, the S&P BSE Sensex plunged 807 points, or nearly 2 per cent, to settle at 40,363 levels. On the NSE, the benchmark Nifty lost 251 points or over 2 per cent to end the session at 11,829 levels.
But, Can You Predict Such Movements In Advance?
While news-driven movement in the markets can be a bit difficult to gauge, but how the markets play out over a few sessions can be plotted on the charts to ascertain the overall trend with reasonable accuracy.
Here are some ways you can spot the end of an uptrend or the beginning of a downtrend:
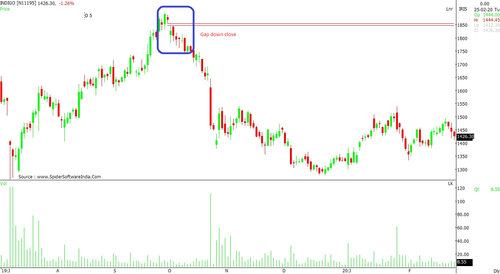
1. Gap-down Close:
Whenever a stock or index closes gap-down, the sentiment is said to have turned weak with the likelihood of the selling pressure intensifying in the coming sessions. A gap-down session is the one where the high of the day does not cross the low of the previous sessions. Such incidents have seen stock prices falling over 5 per cent whenever the selling pressure resumed in the next session.
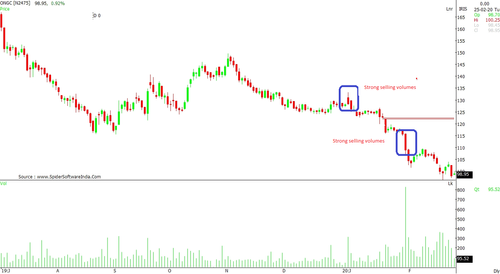
2. Volumes Confirm The Trend:
Whenever a stock falls or shows negative reversal signals, the formation must be supported by volumes. A relatively higher volume suggests that the bears are gaining strength and if a positive reversal is met with selling pressure, then it is a clear indication that the sentiment on the stock/ index is turning bearish.
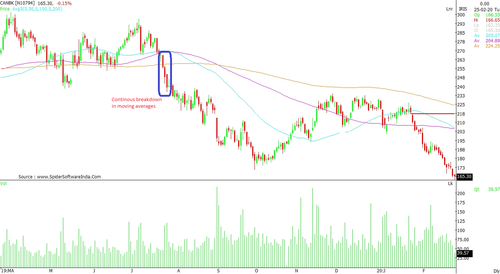
3. Moving Averages:
Another way of looking at the trend is to focus on moving averages. The major moving averages are 50-day moving average (DMA), 100-DMA and 200-DMA. These moving averages work as support levels, which, when broken, may lead to further selling pressure.
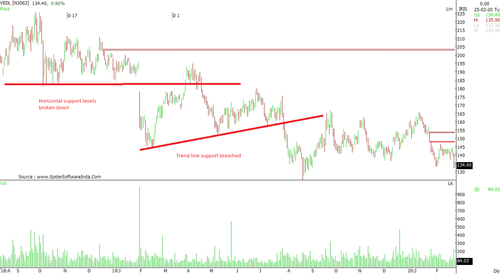
4. Support Levels:
Besides moving averages, support levels can be established on various parameters like trend line support, simultaneous lows, etc. Whenever a security breaches the said support levels, the trend is said to have turned negative.
5. Two-Three Days' High:
In a given situation, when a stock hits near-level highs for a couple of sessions, one can notice the selling pressure emerging around that range. In such a scenario, if the counter breaks the recent lows then more selling pressure is expected, which can push the prices further in a downward spiral.


