

All You Wanted To Know About A 'Pullback' In Trading
- 4m•
- 2,098•
- 20 Apr 2023
A pullback is a healthy correction in the long-term upward trend for a stock or the market / index. This is looked upon as an opportunity to enter a trade that provides a window for bigger return over the long ter. When a chart portrays a rally on breakout, it does provide intermittent corrections that traders use to buy. Such rallies give intraday moves wherein one can make quick bucks with a well-versed strategy.
Although, while trading on a pullback strategy, one's risk appetite must be acknowledged, or else, the risk may be severe and can damage the overall performance. Failure to exit a trade may create disparity on the breakout strategy.
Key parameters
To ascertain that the stock or the index is in a pullback mode or a reversal, one must check the following three parameters.
The first is the volume. One needs to see a significant drop in trading volume in case of a price pull-back. If, however, the volume picks up, it could be an indication that sellers are gaining an upper hand and that the stock or the index can continue to drop over the next few sessions.
The second is a negative news trigger that can see the stock price correct. Typically, such announcements can trigger a decline in the price, which could reverse once the clarity on the news development emerges.
Support and resistance levels are the third factor that one needs to check. The pull-back can continue to till the level where buyers are most likely to find the stock price attractive for taking fresh position.
Implication
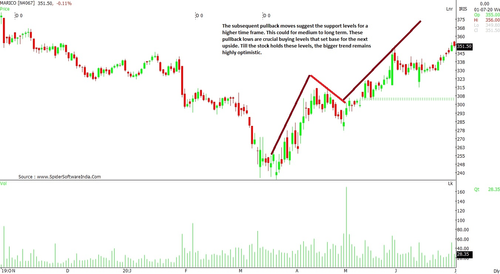
A pullback clearly suggests that the continuation trend is intact and the price should witness buying momentum at higher levels. Within a bigger trend, one can identify several opportunities in terms of chart patterns or candlestick breakout for added profits. Pullback lows are crucial buying levels that set the base for the next upside. Till the stock holds these levels, the bigger trend remains highly optimistic.
How To Identify And Trade A Pullback Rally?
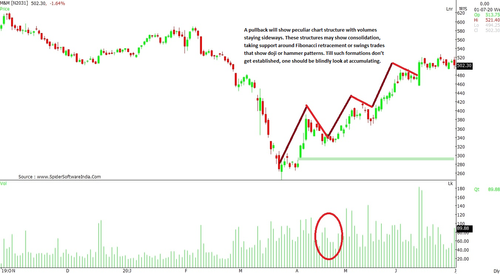
A pullback will show a peculiar chart structure with volumes staying sideways. These structures may show consolidation, taking support around Fibonacci retracement, or swing trades that show Doji or Hammer patterns. Till such formations don’t get established, one should blindly look at accumulating the stock.
A biased interpretation of a pullback may result in losses and fear of capitulation. The correction may turn into a negative reversal if crucial supports are breached with aggressive volume.
Sometimes, the pullback rally gets recognized when some unexpected positive fundamental development adds further momentum to an already established. In such cases, it is advisable to wait for a breakout on consolidation or candlestick pattern to verify the continuation trend. Still, if the structure gets violated, then it is better to exit the stock.
Technical Indicators And Pullback Rallies
Occasionally, technical indicators assist in identifying a pullback. The most significant is the price on the chart. One may see Relative Strength Index (RSI) falling from overbought condition but the price may not show much correction. Similarly, Moving Average Convergence Divergence (MACD) may turn into a negative crossover; however, the price may show sideways movement.
Herein, the significance should be given to the price movement and moving averages. This could be a 50-day moving average (DMA), 100-DMA, 200-DMA or even lesser DMA. On the pullback, these averages will not show much weakness or turn downward; they will gradually continue their current trend and hold the price momentum.


