What Is Stop-loss And How You Can Use It To Limit Losses In Trading
- 4m•
- 1,538•
- 21 Apr 2023
5 technical formations. 2 top Sensex stocks. Here’s what you can learn from their 2019 movements.
Stop-loss is a technique with which a trader can mitigate or stem their losses, if any. While placing a buy/sell order, the trader can choose a “stop-loss order” with a certain price -- just in case the trade goes against the individual's assessment -- and when the stock price arrives at that certain level, the order gets executed as a market order, thus saving the trader from extensive losses.
Simply put, a stop-loss is designed to limit an investor's loss on a stock. Setting a stop-loss order for 15 per cent below the price at which you bought the stock will limit your loss to 15 per cent.
How It Works?
Consider this. Assume that you bought a stock at Rs 1,000 apiece. Right after buying the stock you enter a stop-loss order for Rs 800. If the stock falls below this level (Rs 800), your shares will then be sold at the prevailing market price. The advantage of a stop-loss order is you don't have to monitor how a stock is performing and the trade is executed once the stop-loss level is mentioned.
Key advantages of placing a stop-loss order
-
Don’t have to continuously watch the price movement. Once the order is placed, the trader/investor can rest assured that the trade will get executed.
-
The trader knows the maximum loss he/she might incur in the trade.
-
Stop-loss order gets executed even during system failures. If the brokers' system breaks down, the order placed with the stock exchange via broker still remains active.
-
Few brokers provide additional “trading limit” on stop-loss order.
-
Placing a stop-loss is a positive trading behaviour.
How To Find Stop-loss Level?
-
Moving averages – the 50-day moving average (DMA), 100 DMA, and 200 DMA help identify the stop loss level.
-
Technical indicators like Relative Strength Index (RSI) and Moving Average Convergence Divergence (MACD), as well as their crossover levels, provide an adequate hint of the breakdown trigger.
-
Trendline support also indicates either rising or falling support which may act as stop-loss price.
Real-life examples
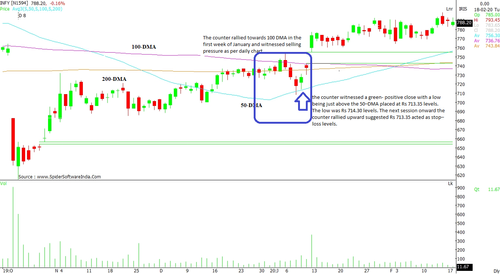
Infosys Ltd (INFY): The counter rallied towards the 100-day moving average (DMA) on the daily chart and witnessed selling pressure in the first week of January 2020. Thereafter, a correction was seen that led to the stock breaching the 50-DMA in intraday. However, on the next day, the counter witnessed a positive close with a low being just above the 50–DMA placed at Rs 713.35 levels. The low level was Rs 714.30. The next session onward, the counter rallied upward with the 50-DMA level of Rs 713.35 acting as stop–loss level for traders.
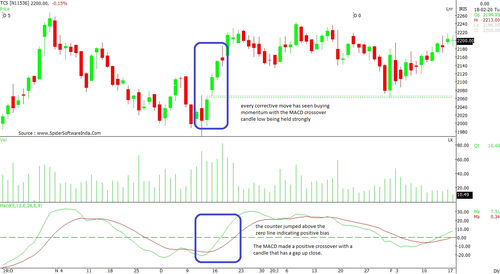
Tata Consultancy Services Ltd (TCS): The MACD made a positive crossover with a candle that had a gap-up close. In the next two sessions, the counter jumped above the zero line indicating positive bias. Thereafter, every corrective move saw buying momentum with the MACD crossover candle low being held strongly. Here, Rs 2065 acted as the stop-loss level for traders.
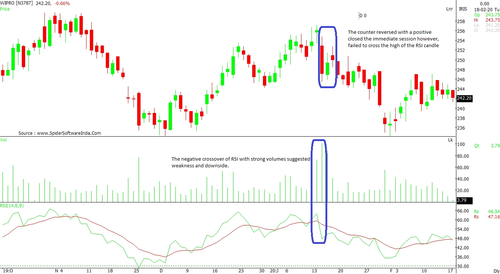
Wipro Ltd (WIPRO): The negative crossover of RSI with strong volumes suggested weakness and downside. The counter reversed with a positive close in the immediate session. However, the stock failed to cross the high of the RSI candle. In the next session, the selling pressure continued and resulted in a breakdown. This indicated the high of the RSI candle at Rs 254.85 that acted as the stop-loss for a short trade.