Stock Market Analysis And More
- 5m•
- 3,866•
- 14 Aug 2023
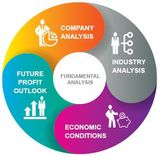
What Is Fundamental Analysis?
This method aims to evaluate the value of the underlying company. It takes into account the intrinsic value of the share keeping in mind the economic conditions and the industry along with the company’s financial condition and management performance. A fundamental analyst would most definitely look at the balance sheet, the profit and loss statement, financial ratios and other data that could be used to predict the future of a company. In other words, fundamental share market analysis is about using real data to evaluate a stock's value. The method uses revenues, earnings, future growth, return on equity, profit margins and other data to determine a company's underlying value and potential for future growth.
The basic belief is that as the company grows so will the value of the share increase. This in turn will benefit the investor in the long run.
What Is An Overvalued Stock Or An Undervalued Stock?
Once you look at the balance sheet and other financial details, you use ratios to compare the financials with the price of the stock. This helps understand how much an investor is really paying in comparison with the company’s growth. The most common ratio used is the Price-to-Earnings or PE ratio. This is computed by dividing the share price with the company’s earnings per share.
If the share price in comparison with its earnings per share is less than industry average, then the stock is said to be undervalued. This means the stock is selling at a much lower price than what it is actually worth.
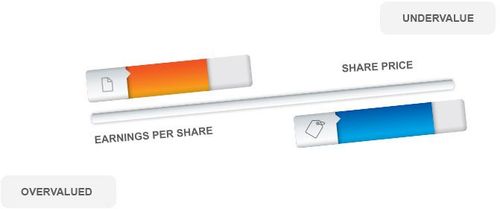
In contrast, an overvalued stock is where the investor is paying more for each rupee the company earns. This means, the stock’s price exceeds its intrinsic value. This often happens when investors expect the company to do well in the future. A high PE in relation to the past PE ratio of the same stock may indicate an overvalued condition, or a high PE in relation to peer stocks may also indicate an overvalued stock.
However, as an investor you have to be very careful. Compare the fundamental value of the stock with its historic values. If there is a sudden increase in valuation, there are high chances that the price may fall to correct the mispricing. In case of a sudden fall in valuation, check for any latest news about the company. It is quite likely that some new factor may have emerged that may be detrimental to the company’s profits.
Since the PE is computed using the earnings per share for the year gone by, it is called a trailing PE. This is not a perfect way to understand the stock’s value. For this reason, analysts often use the forward PE, where the estimated earnings per share for the current or another year is used.
Let us understand using an example.
Suppose a company ABC earns Rs 50 per share. Its current share price is Rs 100. Its PE ratio is thus 2. Suppose, the average PE ratio for the industry is 5, then the company is undervalued. If there is another company in the same industry with a PE ratio of 10, then its stock will be considered to be overvalued.
However, an analyst expects the company to earn Rs 100 per share in the next financial year. Then the forward PE would be 1. This shows that the price is even more undervalued when you consider the company’s growth.
What Is Technical Analysis?
Unlike fundamental analysis, technical analysis has nothing to do with the financial performance of the underlying company. In this method, the analyst simply studies the trend in the share prices. The underlying assumption is that market prices are a function of the supply and demand for the stock, which, in turn, reflects the value of the company. This method also believes that historical price trends are an indication of the future performance.
Thus, instead of assessing the health of the company by relying on its financial statements, it relies upon market trends to predict how a security will perform. Analysts try to cash in on the momentum that builds up over time in the market or a stock.

Technical analysis is often used by short-term investors and traders, and rarely by long-term investors, who prefer fundamental analysis. Technical analysts read and make charts of prices. Some common technical share market analysis measures are the day-moving averages (DMAs), Bollinger bands, Relative Strength Indices (RSI) and so on.
Investing Philosophies:
So now you know about stock market analysis techniques. How does that really help you invest? These investing philosophies will help you understand.
What does value investing mean?
Value investing is an investment style, which favors good stocks at great prices over great stocks at good prices. Hence, it is often referred to as ‘price-driven investing’. A value investor will buy stocks that may be undervalued by the market, and avoid stocks that he believes the market is overvaluing. Warren Buffet, one of the world's best-known investment experts, believes in value investing.
For example, if a stock of a company growing at 10% is selling at Rs 100 with a PE ratio of 10 and another stock of company that also grows at 10% is selling at Rs 150 with a PE ratio of 15, the value investor would select the first stock over the second. This is because the first stock is undervalued in comparison with the second.
Value investors see the potential in the stocks of companies with sound financial statements that they believe the market has undervalued. They believe the market always overreacts to good and bad news, causing stock price movements to not move in tandem with long-term fundamentals. For this reason, they are always on the hunt for undervalued companies.
Value investors profit by taking a position on an undervalued stock (at a deflated price) and then profit by selling the stock when the market corrects its price later. Value investors don't try to predict which way interest rates are heading or the direction of the market and the economy in the short term. They only look at a stock's current valuations and compare them to their historical range.
In other words, they pick up the stocks as fledglings and cash in on them when they are valued right in the markets.
For example, say a particular stock's PE ratio has ranged between a low of 20 and a high of 60 over the past five years, value investors would consider buying the stock if its current PE is around 30 or less. Once purchased, they would hold the stock until its PE rose to the 50-60 ranges, before they consider selling it. In case they expect further growth in the future, they may continue to hold.
What is contrarian philosophy?
As the name suggests, the contrarian philosophy suggests trading against the market sentiment. This means you buy stocks when they are out of favor in the market place, and avoiding stocks that everyone is buying. They then sell these stocks when they gain back the favor.
Contrarians believe in taking advantages that arise out of temporary setbacks or negative news that have caused a stock’s price to decline.
A simple example of the contrarian philosophy would be buying umbrellas in the winter at a cheap rate and selling them during rainy days. Value investing is a kind of contrarian philosophy.
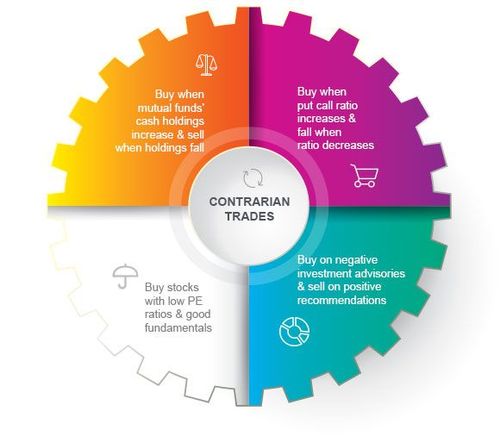
How To Place Contrarian Trades?
If you are a contrarian trader:
-
Conduct stock market analysis. Find out stocks with low PE ratios.
-
Once you do that, compare with historical PE ratios and share prices.
-
Read up about the company, its financial performance and future outlook. If you are satisfied that the company is inherently worthy, select the stock.
-
Wait for the prices to decline. Buy at lows.
-
You could also look at market indicators like mutual fund cash positions, and put/call ratios, and investment advisory opinions. Mutual funds hold a portion of their assets as cash. A greater cash holding suggests that mutual funds are bearish, while a low cash holding means mutual funds are investing money in the markets. This means they are bullish. Once you understand this, take an exactly opposite position. Sell when MFs are buying and buy when they are selling.
-
A put option is an agreement to sell in the future in the derivatives market, while a call option is when you agree to buy in the future. The put/call ratio helps you understand the proportion of put options and call options. The higher this ratio, the greater the put options, and vice versa. An increase in put options suggests that the market is bearish, while demand for call options means the market is bullish. As a contrarian trader, you should prepare accordingly.
-
Investment advisories are issued by many brokerage firms and investment banks, which regularly conduct analysis of individual stocks, industries and the overall economy. A positive recommendation often leads to an increase in share price as investors buy the stock. Contrarian traders could buy when negative investment advisories are issued, and sell after positive recommendations.