

All You Wanted To Know About Candlestick Charts
- 3m•
- 1,437•
- 20 Apr 2023
There are various chart types available for technical analysis, including line charts, renko charts, bar charts, among others, but none is more popular than the candlestick chart form. Traders and analysts prefer candlestick charts as they are relatively easier to read. Each candlestick represents a trading session and gives information about the open, high, low, and close in a more precise manner than other chart types.
Every aspect of candlestick chart helps traders easily read a trend even if he/she has a basic understanding about candles. That said, one has to master the study of candlesticks to reap the maximum benefit.
The various aspects of candlestick charts are candlestick patterns, chart patterns, gaps, and specific candles like hammer, doji, marubozu, etc. The occurrence of each of these components have a major impact on the sentiment of market participants as the formation exhibits the next possible move.
What Do The Candlestick Charts Illustrate?
-
A candlestick representation of prices helps traders easily understand the movement and trend.
-
It shows the relationship of a green close and a red close with the previous prices.
-
It represents the price in intraday, daily, weekly, and other time frames
How Can You Benefit?
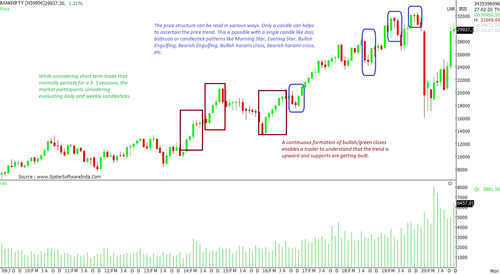
A candlestick price structure can be read in various ways. Sometimes, even one candle can help ascertain the price trend. This is possible with a single candle like doji, marubozu, or candlestick patterns like Morning Star, Evening Star, Bullish Engulfing, Bearish Engulfing, Bullish harami cross, bearish harami cross, etc.
A continuous formation of bullish/green closes usually means the trend is upward and supports are being built. The moment the price starts to show weakness, one can conclude that the selling pressure is causing resistance.
Looking at the charts on a broader time-frame, one can easily identify the prevailing bullish or bearish sentiment. Whenever the stock or index crosses significant candlestick levels, the trend is said to have gained momentum. Such a move's strength can be ascertained by the various forms of candlestick patterns.
A candle high, low, open, and close illustrate the sentiment of traders. A deep study of these components helps traders develop an idea about the overall sentiment, which one can do on daily, weekly, and intraday scales. This enables traders and market participants to gain insights into the prevailing trading behavior.
Immediate / Short-term Trades
Whenever a trader enters a trade, it needs to be based on a clearly-defined setup. This helps churn out consistent performance which, in turn, can generate gradual profits. Merely having knowledge about the candles does not help; one needs to establish a trading setup. For intraday set-up, analysing a stock on 10 mins, 15 mins, and hourly charts can help the market participant take an informed decision. One can also consider the daily charts as well for this purpose.
While considering short-term trade, which normally persists for 3- 5 sessions, market participants should evaluate daily and weekly candlesticks. Indeed, combining other indicators with candlestick charts does help to a great extent. The daily and weekly charts need to be clearly exhibiting a specific trend rather than an ambiguous one, as it is the former kind that usually helps deliver comfortable returns for investors.


