

How To Use Technical Analysis To Spot Overbought And Oversold Stocks
- 4m•
- 6,458•
- 18 Aug 2023
Overbought and oversold conditions, categorised as such according to the position of a stock price / market level with respect to a certain threshold, can be a psychological trigger for traders to either enter or exit the security and even markets. The categorisation can be on the basis of either fundamental or technical analysis.
Fundamental Analysis
The basic idea of fundamental analysis is to determine the intrinsic or 'fair value' of a stock. In a fundamental study, the corporate / business development or similar incidences may lead to an enormous change in price, which investors may feel is either over/under priced. This study revolves around price – earnings ratio (PE ratio), cash flow analysis and financial results or estimates that affect the price movement in various ways. Other developments pertaining to the industry / sector a company operates in and the prevalent tax laws also have an impact on the performance of the company, which in turn is reflected in the stock price. Using these metrics, an investor can identify fair, undervalued and overvalued stocks, and take positions accordingly.
Technical Analysis
Technical analysis, on the other hand, studies the price movement of a stock and uses various tools and indicators to forecast the direction. In doing so, it identifies the price levels based on volumes, average price movement, strength and momentum. Indicators like Relative Strength Index (RSI) and Bollinger band have predefined overbought and oversold conditions, which are the triggers for a trader to take certain positions.
Relative Strength Index (RSI)
This indicator determines the strength of a stock on a scale of 0 to 100. The values above 70 are considered as overbought and values below 30 as oversold. The overbought stocks are viewed as costly and are prone to profit booking. This in-turn may see buying momentum on correction, which needs to be watched closely for the next upside.
Bollinger bands
This defines overbought or oversold conditions on the basis of “two standard deviation lines” surrounding the simple moving average. If the stock price moves above the upper band, it is considered as overbought and if the same falls below the lower band then it is viewed as oversold.
What do overbought and oversold conditions tell you?
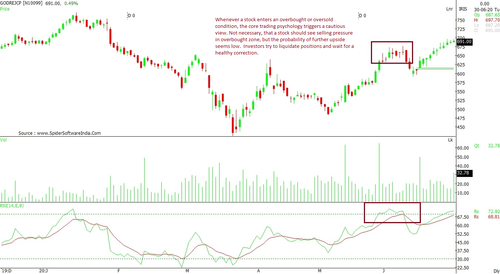
Whenever a stock enters an overbought or oversold condition, the core trading psychology triggers a cautious view. Although, it is not necessary for the stock to see selling pressure once it enters the overbought zone, the probability of further upside is still low. Hence, investors try to liquidate positions and wait for a healthy correction. The idea behind this strategy is to book profit and take a fresh view. Although, this may not necessarily result in an entry on the same stock. In fact, in many cases, investors find better opportunities rather than entering the same stock. (Godrej Consumer chart)
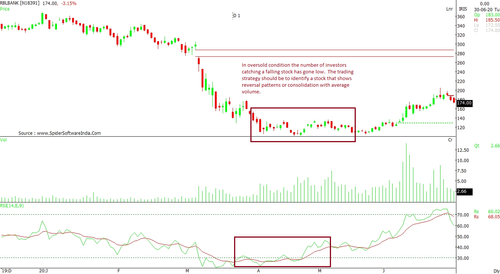
Similarly, in an oversold condition, the trading strategy should be to identify a stock that shows reversal patterns or consolidation with average volume. (RBL Bank chart)
All technical indicators can help determine the strength or direction of a stock based on their own parameters. The idea should be to identify a stock that shows minimum noise and as the price nears the predetermined levels, you are ready to ride the subsequent wave.


