

Is It Just A Retracement Or A Reversal? Here's How To Tell The Difference
- 3m•
- 1,534•
- 24 Apr 2023
Retracement and reversal are two diverse aspects of trading. While the former depicts the occasional correction in stock prices or indices, which are considered healthy, the latter means a deeper decline and change in sentiment. In order to identify them, the foremost requirement is the trader's ability to determine the trend of a stock, which requires knowledge of fundamental and technical analysis.
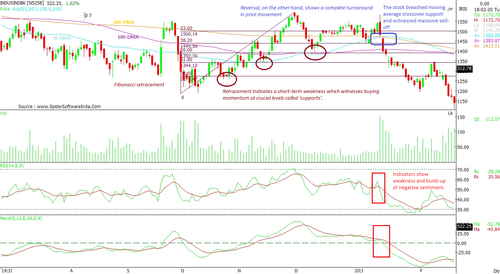
Retracement indicates a short-term weakness which witnesses buying momentum at crucial levels called 'supports'. The support levels may vary and depend on various aspects of price like volume, selling pressure, candlestick patterns, and overbought/oversold conditions.
Reversal, on the other hand, shows a complete turnaround in price movement. It depicts the scenario when the price is declining and is an indication that the price is in correction and downside is not capped at any supports. The weakness in price receives added selling pressure when volumes start to surge on a negative close.
Key Differences:
1. Retracement:
- Price holds support levels
- Price correction is time-bound
- Volumes surge on corrective moves
- Other price indicators like moving averages, Bollinger band, trendline don’t show firm breakdown
- Price shows strength and momentum in itself. Later, technical indicators like RSI and MACD follow it.
2. Reversal:
- Price breaks support levels.
- Price correction witnesses uncertain period
- Volume surge on added weakness
- Indicators show weakness and build-up of negative sentiment.
- RSI and MACD drag the price and further boost the negative strength
Why Is It Necessary To Distinguish Between Retracement And Reversal?
A retracement, if viewed as reversal, may lead to severe losses. The ability to clearly identify both of them assists one in weighing the potential short-term and medium-term gains. A retracement may provide the trader with an opportunity to gain small profits as well as allow him/her to enter a bigger uptrend. Reversal, on the other hand, may provide a bigger opportunity, if recognized well in advance.
Retracements give one opportunity to enter a missed trade while reversal is a complete change in the existing sentiment. Identifying a right reversal adds value to traders' decision-making and improves trading confidence. One needs to build a separate trading model to identify retracement and reversal
Factors That Help In Identifying Retracement And Reversal
Retracement can be derived from various aspects; the most commonly recognized is Fibonacci retracement. This identifies the most likely percentages where a stock can retrace and show a rebound. The levels of 23.6 per cent, 38.2 per cent, 50 per cent, 61.8 per cent, and 78.6 per cent are the major retracement levels to consider while analysing a stock.
Moving averages also play a significant role. A potential reversal can be identified if short-term moving averages converge with long term average.
Volume also delivers a clear picture. A sharp rise or swings in volumes give the first sign of reversal and if this continues for a few more sessions, one can look weakness in the stock.
Candlestick patterns need to be correlated with larger charts. A daily chart might not give enough clarity, however, studying weekly and monthly chart can help clear the doubts in such cases.


