

Here's How Trendlines Can Help Traders Catch That Perfect Breakout
- 4m•
- 1,885•
- 21 Feb 2025
A trendline indicates a broad trend, especially when considered on a bigger scale and aids helps in developing a trading strategy. A trendline is drawn considering the “lower lows” in terms of support and “higher highs” as resistance points to identify the next influential levels. This could take a horizontal form as well. The idea is to recognize whether the price is holding the trendline or not.
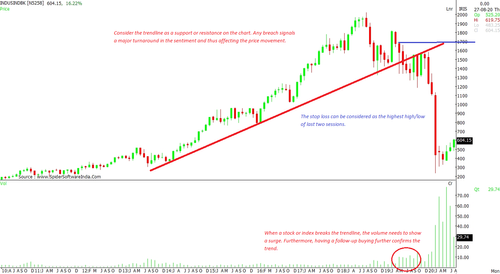
Nowadays, most day-traders use trendlines to get a sense of the trading sentiment. Basically, they consider the trendline as a support or resistance on the chart. Any breach of the same signals a major turnaround in the sentiment and thus affects the price movement.
When looked at a bigger scale, like monthly or yearly, trendlines are crucial in determining the breakout and breakdown views. A trendline breakout on the monthly chart asserts that the stock or index is ready to move higher, with an optimistic outlook. Similarly, a trendline breakdown reflects the onset of a bearish sentiment that eventually hampers the price's up move.
How To Trade With Trendlines?
-
When a stock or index breaks the trendline, volumes need to surge. Follow-up buying confirms the trend.
-
The breaking candle needs to decisively close to carry forward the same momentum.
-
One can also take the assistance of technical indicators that exhibit overbought and oversold conditions.
-
The stop-loss can be considered as the highest high/ lowest low of the last two sessions.
How Reliable Is A Trendline Indicator?
This indicator provides relevant information about the trend; however, in a short time-frame, it also reflects wild swings. Due to this, trendlines are majorly used to gauge the medium-to-long term view. Herein, a trendline break helps one build or exit their positions.
On the short-term scale, the trendline indicator needs assistance from the volume parameter. It isvery unlikely that trendline alone can perfectly identify a shift in sentiment.
It is extremely difficult to identify the right high or low to draw a perfect trendline. Sometimes, the price action is furious and unpredictable, with wild swings, making identifying a perfect pricelevel quite complex.
Apart from these, trendlines play a significant role in chart formations. Patterns like the Rising channel pattern, Falling channel pattern, Ascending triangle, Symmetrical triangle, Descendingtriangle rely on trendlines for their formation.
What Is The Right Time To Look For A Trendline Break?
-
When the entire sector or benchmark indices are in extreme bullish phase
-
When the price trades in the consolidation range for quite a while
-
The price starts scaling highs without any healthy corrective moves
-
The stocks witnesses a rise in volumes without the price showing any volatility


