

Here's How To Gauge Support And Resistance Reversals For Consistent Profits
- 4m•
- 1,095•
- 24 Apr 2023
Support and resistance are two distinct aspects of price, but together they represent the importance of significant levels that have a major impact on the trend. Support is the area that facilitates buying momentum, whereas resistance is the roof level that the price is unable to conquer or go beyond.
A number of market participants trade only on the basis of support and resistance zones. This seems risky, but over the years, this theory has proven to be a reliable trading model. A perfect determination of a support or resistance indicates “when to enter and when to exit” the trade. A good trading system needs to have these characteristics to make consistent profits.
A strong support or resistance can eventually build or disrupt the overall technical view. This may even further alter the sentiment of a stock or the entire market. Moreover, trading along the support and resistance levels also helps one construct a long-term outlook.
Reversals depict the most reliable levels that show a rebound in a price move. Whenever a stock or market takes a turn from a support or resistance, it is said to have established a definite reversal. This rebound provides an adequate idea about strength and sentiment of the trend.
Key points to remember
During a reversal, the candlestick formation plays a crucial part as the candle's structure can help one gauge the underlying strength of the trend and thus enter a potential rally.
Always consider the volatility of volume during a rebound. A stable or gradual surge in volume shows participants becoming interested, signalling the likelihood of the sentiment staying firm.
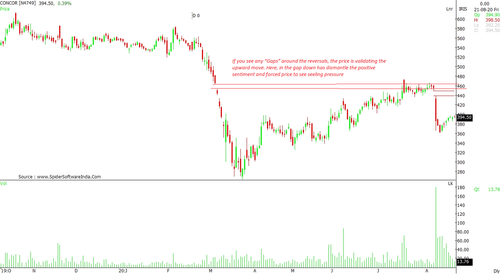
If you see any “Gaps” around the reversals, the price is validating the upward move. (CONCOR chart)
Moving averages, Fibonacci Retracements, and trend lines forecast the support and resistance levels.
How To Trade Along The Reversals?
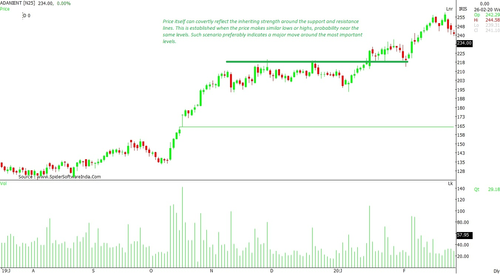
Besides moving averages, retracement, and trend lines, the price itself can covertly reflect the inherent strength around the support and resistance lines. This is established when the price makes similar lows or highs, especially near similar levels. Such a scenario preferably indicates a major move around the most important levels. (ADANIENT chart)
Whenever the price shows reversal from such scenarios, the support levels or resistance levels get established and a rebound occurs. Trading with such reversal provides the safest bet anyone can bet on. Placing a stop loss below the support lines or above the resistance line can deliver a well-calculated trade.
If, in case, the price shows consolidation, or say, mild movement, it might be an indication of a probable reversal since the price is resisting the breakdown. Once the reversal occurs when the price breaks out of that mild consolidation, one can grab the opportunity to ride the momentum.
Always remember, identifying a perfect reversal is difficult. However, by studying the strength and sentiment, one can develop the skill set necessary to gauge the rebound.


