All You Wanted To Know About Support And Resistance Levels
- 4m•
- 1,597•
- 21 Apr 2023
Support and resistance are two points that indicate positive and negative reversals, respectively, in trading. Support shows the level where traders or investors are ready to buy, causing the buying momentum to emerge while selling pressure diminishes. In resistance, the buying strength starts to peter out, exhibiting buyers' exhaustion at that level and sellers' entry into the market.
What Does Support And Resistance Tell You?
-
The first sign of a change in trend can be identified by support and resistance levels.
-
The strength of a counter depends on the ability to hold support levels and cross resistance range.
-
The strategies of support or resistance levels may vary for each stock. The same technical tool may not hold true for every counter.
-
Deep study of support and resistance helps in early entry or timely exit.
-
For a short-term trade, small moving averages can be employed. However, from a medium-term perspective, a larger moving average needs to be taken into consideration.
Different Ways To Identify Support And Resistance Levels:
- Fibonacci Retracement:
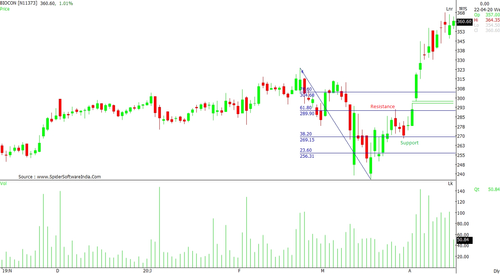
Fibonacci ratio highlights support and resistance levels based on the extent of retracement in terms of percentage. The phenomenon caters to the likely percentage retracement of a strong rise that may see an addition in volumes. The Fibonacci retracement levels are 23.6 per cent, 38.2 per cent, 61.8 per cent, and 78.6 per cent.

- Moving Averages:
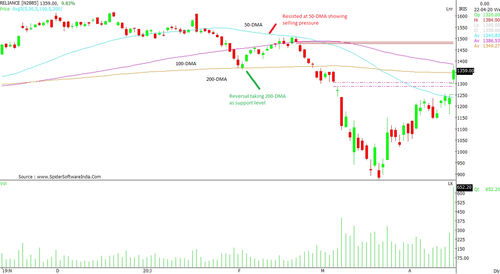
Simple moving average is an average of price for a certain period of time that helps determine support and resistance levels. The major moving averages are 50-day moving average (DMA), 100-DMA, and 200-DMA. Whenever the counter is hesitant towards climbing further, it may correct towards one of the moving average levels. These averages say that buyers should regain upside on the average traded price of the specified days.

- Trendlines:
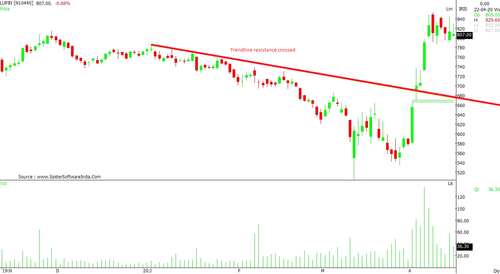
Trendline is plotted considering the points where the counter witnessed buying reversals in the past. Two or more points are selected to draw a line that shows trendline support. This line may be sliding or horizontal, depending on the reversal points. (Lupin chart)

- Other Indicators:
Gap up / Gap down combined with volume also help identify short-term bottom or top. These levels become support or resistance for few forthcoming sessions. Technical indicators like Relative Strength Index (RSI) and Moving Average Convergence Divergence (MACD) also help in understanding the strength levels.
Why Understand Support And Resistance Levels?
Unless supports or resistances are broken, the trend may not develop into a strong rally. When resistance is crossed on the higher side, the next leg of upside may emerge, triggering volume-supported buying. Similarly, when a major support gets breached, the selling pressure provides greater opportunity to “short sell” traders.
If the price holds the support level and shows a reversal with positive formation on charts or technical indicators, then medium-term perspective becomes stronger. Such technical formations alter the medium-term perspective, resulting in an overall trend becoming positive which favors intraday or very short-term trades.


