• Products
    Investment Suite
    Stocks
    Mutual Funds
    Future and Options
    IPO
    Exchange Traded Funds
    Commodity
    Stockcase (Stock Baskets)
    Non Convertible Debentures
    Sovereign Gold Bond
    Exclusive
    NRI Account
    Corporate/HUF Trading Account
    Private Client Group
    Features
    SipIt
    MTF
    Investment Suite
    Exclusive
    Features
    Stocks
    Mutual Funds
    Future and Options
    IPO
    Exchange Traded Funds
    Commodity
    Stockcase (Stock Baskets)
    Non Convertible Debentures
    Sovereign Gold Bond
    NRI Account
    Corporate/HUF Trading Account
    Private Client Group
    SipIt
    MTF
  • Platform
    Trading Platforms
    Kotak Neo App & Web
    Nest Trading Terminal
    NEO Trade APIs
    Trade From Charts
    Features and Tools
    MTF
    Securities Accepted as Collateral
    Margin Requirements
    Equity Screeners
    Payoff Analyzer
    Calculators
    SIP Calculator
    Lumpsum Calculator
    Brokerage Calculator
    Margin Calculator
    MTF Calculator
    SWP Calculator
    CAGR Calculator
    Simple Interest Calculator
    ELSS Calculator
    Step up SIP Calculator
    All Calculators
    Trading Platforms
    Features and Tools
    Calculators
    Kotak Neo App & Web
    Nest Trading Terminal
    NEO Trade APIs
    Trade From Charts
    MTF
    Securities Accepted as Collateral
    Margin Requirements
    Equity Screeners
    Payoff Analyzer
    SIP Calculator
    Lumpsum Calculator
    Brokerage Calculator
    Margin Calculator
    MTF Calculator
    SWP Calculator
    CAGR Calculator
    Simple Interest Calculator
    ELSS Calculator
    Step up SIP Calculator
  • Pricing
  • Research
    Research Calls
    Long Term calls
    Short Term calls
    Intraday calls
    Derivatives calls
    Pick of the week
    Top Monthly Picks
    Stock Research Recommendations
    MTF Stock Recommendations
    Research Reports
    Fundamental Research Report
    Technical Research Report
    Derivative Research Report
    Commodities Research Report
    Research Calls
    Research Reports
    Long Term calls
    Short Term calls
    Intraday calls
    Derivatives calls
    Pick of the week
    Top Monthly Picks
    Stock Research Recommendations
    MTF Stock Recommendations
    Fundamental Research Report
    Technical Research Report
    Derivative Research Report
    Commodities Research Report
  • Market
    Market Movers
    Share Market Today
    Top Gainers
    Top Losers
    52 Week High
    52 Week Low
    Volume Shockers
    Stocks
    Large Cap
    Mid Cap
    Small Cap
    Lenskart Share Price
    Groww Share Price
    LG Electronics Share Price
    Indices
    Nifty 50
    Nifty Bank
    FinNifty
    Nifty Midcap India
    India VIX
    All Indices
    Mutual Funds
    SBI Mutual Funds
    HDFC Mutual Funds
    Axis Mutual Funds
    ICICI Prudential Mutual Funds
    Nippon India Mutual Funds
    All AMC's
    IPO
    Upcoming IPO
    Current IPO
    IPO Allotment Status
    IPO Subscription Status
    Closed IPO
    Recently Listed IPO
    Quarterly Results
    Sterlite Technologies' Q2 FY 2025-26 Quarterly Results
    Sterling Tools' Q2 FY 2025-26 Quarterly Results
    Steel Strips Wheels' Q2 FY 2025-26 Quarterly Results
    Steel City Securities' Q2 FY 2025-26 Quarterly Results
    Market Movers
    Stocks
    Indices
    Mutual Funds
    IPO
    Quarterly Results
    Share Market Today
    Top Gainers
    Top Losers
    52 Week High
    52 Week Low
    Volume Shockers
    Stocks Under 5 Rs
    Stocks Under 10 Rs
    Stocks Under 50 Rs
    Stocks Under 100 Rs
    Stocks Under 500 Rs
    Stocks Under 1000 Rs
    Large Cap
    Mid Cap
    Small Cap
    Lenskart Share Price
    Groww Share Price
    LG Electronics Share Price
    State Bank of India
    Reliance Industries Ltd
    HDFC Bank Ltd
    Infosys Ltd
    Tata Capital
    LG Electronics India
    Tata Consultancy Services Ltd
    Hindustan Unilever Ltd
    ITC Ltd
    IRCTC
    NSE
    Nifty 50
    Nifty Bank
    FinNifty
    Nifty Midcap India
    India VIX
    BSE
    Sensex
    BSE Bankex
    BSE Small Cap
    BSE Mid Cap
    BSE 100
    Global Indices
    Gift Nifty
    Dow Jones
    Nikkei Index
    Hang Seng Index
    KOSPI Index
    AMC's
    SBI Mutual Funds
    HDFC Mutual Funds
    Axis Mutual Funds
    ICICI Prudential Mutual Funds
    Nippon India Mutual Funds
    Schemes
    Parag Parikh Flexi Cap
    SBI Small Cap Fund
    SBI Contra Fund
    Nippon Small Cap Fund
    ICICI Pru Technology Fund
    Silver ETF
    Gold ETF
    NFO
    Upcoming IPO
    Current IPO
    IPO Allotment Status
    IPO Subscription Status
    Closed IPO
    Recently Listed IPO
    Excelsoft Technologies IPO
    Gallard Steel IPO
    Sudeep Pharma IPO
    GNH India Pharmaceuticals IPO
    Xolopak India IPO
    Cleanux Green Solution IPO
    Wildnet Technologies IPO
    Tridib Industries IPO
    Sterlite Technologies' Q2 FY 2025-26 Quarterly Results
    Sterling Tools' Q2 FY 2025-26 Quarterly Results
    Steel Strips Wheels' Q2 FY 2025-26 Quarterly Results
    Steel City Securities' Q2 FY 2025-26 Quarterly Results
    State Bank of India's Q2 FY 2025-26 Quarterly Results
    Star Cement's Q2 FY 2025-26 Quarterly Results
    Stanley Lifestyles' Q2 FY 2025-26 Quarterly Results
    Sree Rayalaseema Hi-Strength Hypo's Q2 FY 2025-26 Quarterly Results
    Rushil Decor's Q2 FY 2025-26 Quarterly Results
    Rupa & Company's Q2 FY 2025-26 Quarterly Results
    Rudrabhishek Enterprises' Q2 FY 2025-26 Quarterly Results
    Rubfila International's Q2 FY 2025-26 Quarterly Results
  • Learn
    Stockshaala
    Basics of Stock Market
    Introduction to Fundamental Analysis
    Introduction to Technical Analysis
    Derivatives, Risk management & Option Trading Strategies
    Personal Finance
    Explore More
    Resource
    Market Ready
    Kotak Insights
    Infographic
    Podcast
    Webinars
    Youtube Channel
    Investing Guide
    Demat Account
    Trading Account
    Share Market
    Intraday Trading
    IPO
    Mutual Funds
    Events
    Budget 2025
    Muhurat Trading
    Share Market Holiday
    Market Outlook 2025
    Stockshaala
    Resource
    Investing Guide
    Events
    Basics of Stock Market
    Introduction to Fundamental Analysis
    Introduction to Technical Analysis
    Derivatives, Risk management & Option Trading Strategies
    Personal Finance
    Market Ready
    Kotak Insights
    Infographic
    Podcast
    Webinars
    Youtube Channel
    Demat Account
    Trading Account
    Share Market
    Intraday Trading
    IPO
    Mutual Funds
    Budget 2025
    Muhurat Trading
    Share Market Holiday
    Market Outlook 2025
  • Partner
    Business Associates
    Kotak Connect Plus
    Startup connect
    Business Associates
    Kotak Connect Plus
    Startup connect
  • Support
    FAQs
    Circulars
    Bulletins
    Contact Us
    Forms Download
    Get your Statement
    FAQs
    Circulars
    Bulletins
    Contact Us
    Forms Download
    Get your Statement
  • News
  • IPO
    Mainboard IPO
    Current IPO
    Upcoming IPO
    Recently Closed IPO
    Recently Listed IPO
    SME IPO
    All SME IPOs
    Current SME IPO
    Upcoming SME IPO
    Recently Closed SME IPO
    Live IPOs
    Capillary Technologies IPO
    View All
    Upcoming IPOs
    Excelsoft Technologies IPO
    View All
    Mainboard IPO
    SME IPO
    Live IPOs
    Upcoming IPOs
    Current IPO
    Upcoming IPO
    Recently Closed IPO
    Recently Listed IPO
    All SME IPOs
    Current SME IPO
    Upcoming SME IPO
    Recently Closed SME IPO
    Capillary Technologies IPO
    Excelsoft Technologies IPO

Key Sell Signals You Should Be Aware Of While Trading

  •  4m
  •  1,536
  • Updated 14 Aug 2023

One needs to examine several elements in order to determine a negative reversal, or a 'sell signal', for a stock or index. The most relevant is the price movement, followed by price indicators like candlestick patterns, chart formations, moving averages, trend line, gap up or gap down, etc.

Apart from the above-mentioned instruments, technical indicators like Relativem Strength Index (RSI), Moving Average Convergence Divergence (MACD), and Stochastic also assist in identifying the trend reversal. Volume plays a crucial role in acknowledging the change in momentum.

When considering a larger outlook, one needs to look at signals wherein the change in trend holds over a month or a quarter.

Here are some 'sell' signals to keep an eye on.

Similarly, Evening Star, Bearish Engulfing and spinning top with a negative candle show a short selling reversal. In these patterns, volumes yield a significant role in providing a firm confirmation. A large volume surge during a breakout suggests a positive outlook.

Moving Average:

Moving average is the average of the price over a certain period of time. To spot a trend reversal or confirm the start of a negative trend, one needs to co-relate more than one average. The basic averages are 50-day moving average (DMA), 100 DMA, and 200-DMA. They all facilitate support and resistance besides assisting technical indicators.

To review from a bigger perspective, one should consider the convergence of these three essential moving averages. A strong “sell signal” evolves when these moving averages cross each other in the downward direction on the daily chart. This indicates that the trend has turned bearish and the price is heading towards a deeper correction. Sometimes, the price shows positive reversal which eventually witnesses selling pressure, resulting in price correction. The price correction exists till the moving averages do not show a reversal. For a sell momentum to slow down, the moving averages must change to upward direction, indicating a shift in the closing prices.
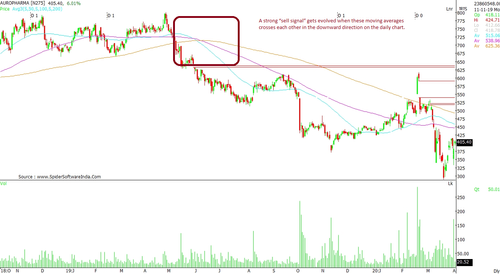
Chart Patterns:

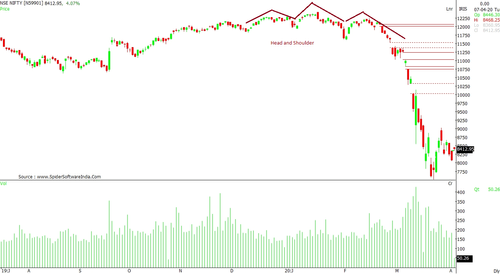
If you spot one of the trend reversal patterns on a breakdown, it may be a sign of further selling pressure in the stock/index. These patterns include Head and Shoulder, Double top, Triple Top, Breakdown in symmetrical triangle, descending triangle, rising channel pattern, trend line breakdown, etc.

Among these patterns, Head and Shoulder and Double Top are the most tracked ones. Even Trendline Breakdown has been identified as one of the most accurate trend reversal patterns. These patterns typically show the stock witnessing selling pressure at higher levels. Going ahead, the selling pressure starts to generate volumes, suggesting the resistance has encouraged short positions. If the counter does not overcome the selling pressure conquering the high levels, the fall or correction intensifies, leading to price correction on stronger volumes. The target price is the difference between the neckline and the high price of the pattern.

Sometimes, the correction after a breakdown leads to a bearish sentiment that can last for a year. A candlestick pattern on the “breakdown neckline” also helps in acknowledging the strength of the falling price. If you can spot formations like the Evening Star, Doji or Bearish Engulfing, it may help confirm a sell signal.

Technical Indicators:

Various technical indicators help in trading or identifying a trend reversal. The main ones are RSI and MACD. The RSI reveals the strength by identifying the overbought and oversold condition, whereas the MACD locates the price momentum, strength, duration and direction of the counter.

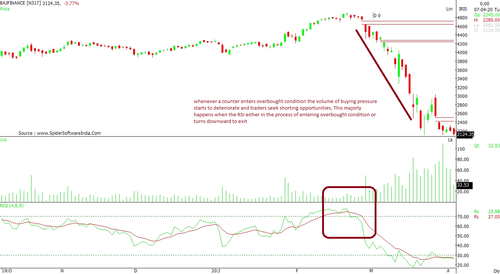
Relative Strength Index (RSI):

It is relatively difficult to recognize a trend reversal when the RSI trades between the oversold and overbought condition. For a sell signal to emerge, the overbought condition should coincide with profit booking or trend reversal. Primarily, whenever a counter enters overbought condition, the volume of buying pressure starts to deteriorate and traders seek shorting opportunities. This mainly happens when the RSI is about to enter the overbought condition or turns downward to exit.

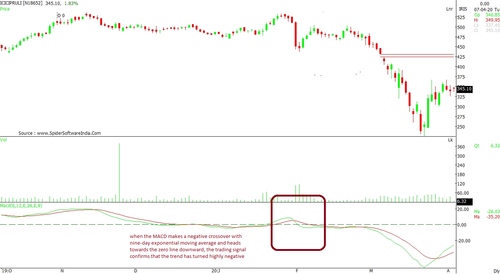
Moving Average Convergence Divergence (MACD):

The best signal on this indicator is the zero line that differentiates between the positive and negative strength as well as the direction. Simply put, when the MACD makes a negative crossover with nine-day exponential moving average and heads towards the zero line downward, the trading signal confirms that the trend has turned highly negative and the counter is moving towards a bearish sentiment.

That said, both the indicators co-relate with the price. The counter needs to confirm a trend with a strong negative close; otherwise, the sell signal may see lower strength, inevitably with lower downside.

Did you enjoy this article?

0 people liked this article.

What could we have done to make this article better?

Read Full Article >
Open Your Demat Account Now!
+91 -

Open Your Demat Account Now!
+91 -