• Products
    Investment Suite
    Stocks
    Mutual Funds
    Future and Options
    IPO
    Exchange Traded Funds
    Commodity
    Stockcase (Stock Baskets)
    Non Convertible Debentures
    Sovereign Gold Bond
    Exclusive
    NRI Account
    Corporate/HUF Trading Account
    Private Client Group
    Features
    SipIt
    MTF
    Investment Suite
    Exclusive
    Features
    Stocks
    Mutual Funds
    Future and Options
    IPO
    Exchange Traded Funds
    Commodity
    Stockcase (Stock Baskets)
    Non Convertible Debentures
    Sovereign Gold Bond
    NRI Account
    Corporate/HUF Trading Account
    Private Client Group
    SipIt
    MTF
  • Platform
    Trading Platforms
    Kotak Neo App & Web
    Nest Trading Terminal
    NEO Trade APIs
    Features and Tools
    MTF
    Securities Accepted as Collateral
    Margin Requirements
    Equity Screeners
    Payoff Analyzer
    Calculators
    SIP Calculator
    Lumpsum Calculator
    Brokerage Calculator
    Margin Calculator
    MTF Calculator
    SWP Calculator
    CAGR Calculator
    Simple Interest Calculator
    ELSS Calculator
    Step up SIP Calculator
    All Calculators
    Trading Platforms
    Features and Tools
    Calculators
    Kotak Neo App & Web
    Nest Trading Terminal
    NEO Trade APIs
    MTF
    Securities Accepted as Collateral
    Margin Requirements
    Equity Screeners
    Payoff Analyzer
    SIP Calculator
    Lumpsum Calculator
    Brokerage Calculator
    Margin Calculator
    MTF Calculator
    SWP Calculator
    CAGR Calculator
    Simple Interest Calculator
    ELSS Calculator
    Step up SIP Calculator
  • Pricing
  • Research
    Research Calls
    Long Term calls
    Short Term calls
    Intraday calls
    Derivatives calls
    Pick of the week
    Top Monthly Picks
    Stock Research Recommendations
    MTF Stock Recommendations
    Research Reports
    Fundamental Research Report
    Technical Research Report
    Derivative Research Report
    Research Calls
    Research Reports
    Long Term calls
    Short Term calls
    Intraday calls
    Derivatives calls
    Pick of the week
    Top Monthly Picks
    Stock Research Recommendations
    MTF Stock Recommendations
    Fundamental Research Report
    Technical Research Report
    Derivative Research Report
  • Market
    Market Movers
    Share Market Today
    Top Gainers
    Top Losers
    Stocks
    Large Cap
    Mid Cap
    Small Cap
    Indices
    Nifty 50
    Bank Nifty
    FinNifty
    Nifty Midcap India
    VIX
    All Indices
    Mutual Funds
    SBI Mutual Funds
    HDFC Mutual Funds
    Axis Mutual Funds
    ICICI Prudential Mutual Funds
    Nippon India Mutual Funds
    All AMC's
    IPO
    Upcoming IPO
    Current IPO
    Closed IPO
    Recently Listed IPO
    Tata Capital IPO
    Quarterly Results
    Alps Industries' Q1 FY 2025-26 Quarterly Results
    Brightcom Group's Q1 FY 2025-26 Quarterly Results
    Visa Steel's Q1 FY 2025-26 Quarterly Results
    Coffee Day Enterprises' Q1 FY 2025-26 Quarterly Results
    Market Movers
    Stocks
    Indices
    Mutual Funds
    IPO
    Quarterly Results
    Share Market Today
    Top Gainers
    Top Losers
    52 Week High
    52 Week Low
    Volume Shockers
    Large Cap
    Mid Cap
    Small Cap
    State Bank of India
    Reliance Industries Ltd
    HDFC Bank Ltd
    Infosys Ltd
    Tata Consultancy Services Ltd
    Hindustan Unilever Ltd
    ITC Ltd
    IRCTC
    NSE
    Nifty 50
    Bank Nifty
    FinNifty
    Nifty Midcap India
    VIX
    BSE
    Sensex
    BSE Bankex
    BSE Small Cap
    BSE Mid Cap
    BSE 100
    Indian Indices
    Global Indices
    Gift Nifty
    S&P
    Nikkei Index
    Hong Kong Index
    KOSPI Index
    Global Indices
    AMC's
    SBI Mutual Funds
    HDFC Mutual Funds
    Axis Mutual Funds
    ICICI Prudential Mutual Funds
    Nippon India Mutual Funds
    Schemes
    Parag Parikh Flexi Cap
    SBI Small Cap Fund
    SBI Contra Fund
    Nippon Small Cap Fund
    ICICI Pru Technology Fund
    Upcoming IPO
    Current IPO
    Closed IPO
    Recently Listed IPO
    Tata Capital IPO
    Studio LSD Ltd
    Gem Aromatics Ltd IPO
    Shreeji Shipping Global Ltd IPO
    Patel Retail Limited IPO
    Vikram Solar Ltd
    LGT Business Connextions IPO
    Mangal Electrical Industries IPO
    boAt IPO
    Alps Industries' Q1 FY 2025-26 Quarterly Results
    Brightcom Group's Q1 FY 2025-26 Quarterly Results
    Visa Steel's Q1 FY 2025-26 Quarterly Results
    Coffee Day Enterprises' Q1 FY 2025-26 Quarterly Results
    Supreme Holdings & Hospitality's Q1 FY 2025-26 Quarterly Results
    Kavveri Defence & Wireless Technologies' Q1 FY 2025-26 Quarterly Results
    Knowledge Marine & Engineering Works' Q1 FY 2025-26 Quarterly Results
    Lloyds Enterprises' Q1 FY 2025-26 Quarterly Results
    Western Carriers (India)'s Q1 FY 2025-26 Quarterly Results
    Vipul's Q1 FY 2025-26 Quarterly Results
    Tarmat's Q1 FY 2025-26 Quarterly Results
    SRM Contractors' Q1 FY 2025-26 Quarterly Results
  • Learn
    Stockshaala
    Basics of Stock Market
    Introduction to Fundamental Analysis
    Introduction to Technical Analysis
    Derivatives, Risk management & Option Trading Strategies
    Personal Finance
    Resource
    Market Ready
    Kotak Insights
    Infographic
    Podcast
    Webinars
    Youtube Channel
    Investing Guide
    Demat Account
    Trading Account
    Share Market
    Intraday Trading
    IPO
    Mutual Funds
    Events
    Budget 2025
    Muhurat Trading
    Share Market Holiday
    Market Outlook 2025
    Stockshaala
    Resource
    Investing Guide
    Events
    Basics of Stock Market
    Introduction to Fundamental Analysis
    Introduction to Technical Analysis
    Derivatives, Risk management & Option Trading Strategies
    Personal Finance
    Market Ready
    Kotak Insights
    Infographic
    Podcast
    Webinars
    Youtube Channel
    Demat Account
    Trading Account
    Share Market
    Intraday Trading
    IPO
    Mutual Funds
    Budget 2025
    Muhurat Trading
    Share Market Holiday
    Market Outlook 2025
  • Partner
    Business Associates
    Kotak Connect Plus
    Startup connect
    Business Associates
    Kotak Connect Plus
    Startup connect
  • Support
    FAQs
    Circulars
    Bulletins
    Contact Us
    Forms Download
    Get your Statement
    FAQs
    Circulars
    Bulletins
    Contact Us
    Forms Download
    Get your Statement
  • News

How To Use Directional Movement Index In Trading

  •  3m
  •  1,512
  • Updated 21 Apr 2023

Whenever, the +D and -D make a crossover, the trend is expected to shift in a more concrete manner in the respective trend in all time frames.

The Directional Movement Index (DMI) determines the direction in which the trend is headed, while also providing an idea about the strength and momentum of the trend. In fact, J. Welles Wilder had invented this indicator in order to understand the direction of stocks or indexes.

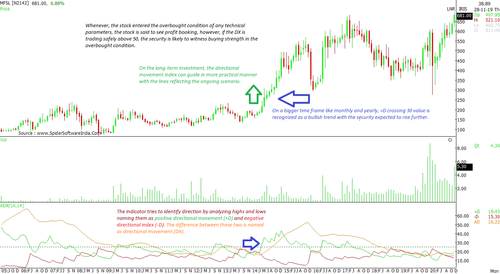
The indicator tries to identify direction by analysing highs and lows, labelled as positive directional movement (+D) and negative directional index (-D), respectively. The difference between these two is named as directional movement (DX). Herein, when +D is above –D, the trend is said to be upward, with sentiments gradually rising towards optimism. And when –D is above +D, the direction is said to be dominated by negative sentiment.

Key Significance

  • The crossovers of + D and –D are seen as the trigger for buy and sell strategy.

  • Big difference between the two movements suggests a firm and strong momentum.

  • Whenever DX is combined with indicators like RSI and MACD, it tends to perform even better

  • The directional movement index can guide long-term investors in a more practical sense, with the lines reflecting the current scenario

  • Whenever the +D crosses 30 value, the direction is said to have attained extreme buying support and price is expected to scale higher levels. Meanwhile, when it nears the value 50, the trend is expected to witness selling pressure.

How To Use?

Usually, this indicator performs better when combined with other oscillators. However, even the individual signals exhibited by this indicator are very useful. The key in any sort of trading is to identify the direction of a stock's trend. One can find a high price or low price, but if he/she is unable to determine the direction, then the trade setup becomes highly questionable. In that regard, the DMI does assist in identifying the immediate trend in daily and weekly charts. +D rising above 25 value is recognized as a bullish sign and encourages buying momentum, which may see a sudden upside. On the negative side, -D rising above 25 value is considered as a sell / weak signal.

On a bigger time frame like monthly and yearly, +D crossing 30 value is recognized as a bullish trend with the security expected to rise further. Whenever the DX climbs the 50 value, the trend is said to be highly bullish on the daily time frame.

Whenever, the +D and –D make a crossover, the trend is expected to shift in a more concrete manner in the respective trend in all time frames.

That said, usually, this indicator is not used in the intraday time frame as the signals get a little delayed in terms of the sudden spike in security.

In A Nut Shell:

Besides +D and –D, the DX has a significant impact on the security. DX categorically identifies stocks that have or are likely to build strong upward/ bullish sentiment. Whenever a stock enters the overbought condition from any technical parameter, the stock is said to see profit booking. However, if the DX is trading safely above 50, the security is likely to witness buying strength in the overbought condition.

Did you enjoy this article?

0 people liked this article.

What could we have done to make this article better?

Read Full Article >
Stock NameMarket Price
-
-
-
-
-
-
-
-
-
-
Open Your Demat Account Now!
+91 -

Open Your Demat Account Now!
+91 -