• Products
    Investment Suite
    Stocks
    Mutual Funds
    Future and Options
    IPO
    Exchange Traded Funds
    Commodity
    Stockcase (Stock Baskets)
    Non Convertible Debentures
    Sovereign Gold Bond
    Exclusive
    NRI Account
    Corporate/HUF Trading Account
    Private Client Group
    Features
    SipIt
    MTF
    Investment Suite
    Exclusive
    Features
    Stocks
    Mutual Funds
    Future and Options
    IPO
    Exchange Traded Funds
    Commodity
    Stockcase (Stock Baskets)
    Non Convertible Debentures
    Sovereign Gold Bond
    NRI Account
    Corporate/HUF Trading Account
    Private Client Group
    SipIt
    MTF
  • Platform
    Trading Platforms
    Kotak Neo App & Web
    Nest Trading Terminal
    NEO Trade APIs
    Trade From Charts
    Features and Tools
    MTF
    Securities Accepted as Collateral
    Margin Requirements
    Equity Screeners
    Payoff Analyzer
    Calculators
    SIP Calculator
    Lumpsum Calculator
    Brokerage Calculator
    Margin Calculator
    MTF Calculator
    SWP Calculator
    CAGR Calculator
    Simple Interest Calculator
    ELSS Calculator
    Step up SIP Calculator
    All Calculators
    Trading Platforms
    Features and Tools
    Calculators
    Kotak Neo App & Web
    Nest Trading Terminal
    NEO Trade APIs
    Trade From Charts
    MTF
    Securities Accepted as Collateral
    Margin Requirements
    Equity Screeners
    Payoff Analyzer
    SIP Calculator
    Lumpsum Calculator
    Brokerage Calculator
    Margin Calculator
    MTF Calculator
    SWP Calculator
    CAGR Calculator
    Simple Interest Calculator
    ELSS Calculator
    Step up SIP Calculator
  • Pricing
  • Research
    Research Calls
    Long Term calls
    Short Term calls
    Intraday calls
    Derivatives calls
    Pick of the week
    Top Monthly Picks
    Stock Research Recommendations
    MTF Stock Recommendations
    Research Reports
    Fundamental Research Report
    Technical Research Report
    Derivative Research Report
    Commodities Research Report
    Research Calls
    Research Reports
    Long Term calls
    Short Term calls
    Intraday calls
    Derivatives calls
    Pick of the week
    Top Monthly Picks
    Stock Research Recommendations
    MTF Stock Recommendations
    Fundamental Research Report
    Technical Research Report
    Derivative Research Report
    Commodities Research Report
  • Market
    Market Movers
    Share Market Today
    Top Gainers
    Top Losers
    52 Week High
    52 Week Low
    Volume Shockers
    Stocks
    Large Cap
    Mid Cap
    Small Cap
    Lenskart Share Price
    Groww Share Price
    LG Electronics Share Price
    Indices
    Nifty 50
    Nifty Bank
    FinNifty
    Nifty Midcap India
    India VIX
    All Indices
    Mutual Funds
    SBI Mutual Funds
    HDFC Mutual Funds
    Axis Mutual Funds
    ICICI Prudential Mutual Funds
    Nippon India Mutual Funds
    All AMC's
    IPO
    Upcoming IPO
    Current IPO
    IPO Allotment Status
    IPO Subscription Status
    Closed IPO
    Recently Listed IPO
    Quarterly Results
    Basilic Fly Studio's Q2 FY 2025-26 Quarterly Results
    TSC India's Q2 FY 2025-26 Quarterly Results
    Orchid Pharma's Q2 FY 2025-26 Quarterly Results
    Usha Martin Education & Solutions' Q2 FY 2025-26 Quarterly Results
    Market Movers
    Stocks
    Indices
    Mutual Funds
    IPO
    Quarterly Results
    Share Market Today
    Top Gainers
    Top Losers
    52 Week High
    52 Week Low
    Volume Shockers
    Stocks Under 5 Rs
    Stocks Under 10 Rs
    Stocks Under 50 Rs
    Stocks Under 100 Rs
    Stocks Under 500 Rs
    Stocks Under 1000 Rs
    Large Cap
    Mid Cap
    Small Cap
    Lenskart Share Price
    Groww Share Price
    LG Electronics Share Price
    State Bank of India
    Reliance Industries Ltd
    HDFC Bank Ltd
    Infosys Ltd
    Tata Capital
    LG Electronics India
    Tata Consultancy Services Ltd
    Hindustan Unilever Ltd
    ITC Ltd
    IRCTC
    NSE
    Nifty 50
    Nifty Bank
    FinNifty
    Nifty Midcap India
    India VIX
    BSE
    Sensex
    BSE Bankex
    BSE Small Cap
    BSE Mid Cap
    BSE 100
    Global Indices
    Gift Nifty
    Dow Jones
    Nikkei Index
    Hong Kong Index
    KOSPI Index
    AMC's
    SBI Mutual Funds
    HDFC Mutual Funds
    Axis Mutual Funds
    ICICI Prudential Mutual Funds
    Nippon India Mutual Funds
    Schemes
    Parag Parikh Flexi Cap
    SBI Small Cap Fund
    SBI Contra Fund
    Nippon Small Cap Fund
    ICICI Pru Technology Fund
    NFO
    Silver ETF
    Gold ETF
    Upcoming IPO
    Current IPO
    IPO Allotment Status
    IPO Subscription Status
    Closed IPO
    Recently Listed IPO
    Tenneco Clean Air India IPO
    Fujiyama Power Systems IPO
    Capillary Technologies India IPO
    Gallard Steel IPO
    Excelsoft Technologies IPO
    Shiprocket IPO
    Vama Wovenfab IPO
    Q-Line Biotech IPO
    Basilic Fly Studio's Q2 FY 2025-26 Quarterly Results
    TSC India's Q2 FY 2025-26 Quarterly Results
    Orchid Pharma's Q2 FY 2025-26 Quarterly Results
    Usha Martin Education & Solutions' Q2 FY 2025-26 Quarterly Results
    Uravi Defence & Technology's Q2 FY 2025-26 Quarterly Results
    TV Vision's Q2 FY 2025-26 Quarterly Results
    TPL Plastech's Q2 FY 2025-26 Quarterly Results
    Total Transport Systems' Q2 FY 2025-26 Quarterly Results
    Tembo Global Industries' Q2 FY 2025-26 Quarterly Results
    TARC's Q2 FY 2025-26 Quarterly Results
    Surana Telecom and Power's Q2 FY 2025-26 Quarterly Results
    Suraj's Q2 FY 2025-26 Quarterly Results
  • Learn
    Stockshaala
    Basics of Stock Market
    Introduction to Fundamental Analysis
    Introduction to Technical Analysis
    Derivatives, Risk management & Option Trading Strategies
    Personal Finance
    Explore More
    Resource
    Market Ready
    Kotak Insights
    Infographic
    Podcast
    Webinars
    Youtube Channel
    Investing Guide
    Demat Account
    Trading Account
    Share Market
    Intraday Trading
    IPO
    Mutual Funds
    Events
    Budget 2025
    Muhurat Trading
    Share Market Holiday
    Market Outlook 2025
    Stockshaala
    Resource
    Investing Guide
    Events
    Basics of Stock Market
    Introduction to Fundamental Analysis
    Introduction to Technical Analysis
    Derivatives, Risk management & Option Trading Strategies
    Personal Finance
    Market Ready
    Kotak Insights
    Infographic
    Podcast
    Webinars
    Youtube Channel
    Demat Account
    Trading Account
    Share Market
    Intraday Trading
    IPO
    Mutual Funds
    Budget 2025
    Muhurat Trading
    Share Market Holiday
    Market Outlook 2025
  • Partner
    Business Associates
    Kotak Connect Plus
    Startup connect
    Business Associates
    Kotak Connect Plus
    Startup connect
  • Support
    FAQs
    Circulars
    Bulletins
    Contact Us
    Forms Download
    Get your Statement
    FAQs
    Circulars
    Bulletins
    Contact Us
    Forms Download
    Get your Statement
  • News
  • IPO
    Mainboard IPO
    Current IPO
    Upcoming IPO
    Recently Closed IPO
    Recently Listed IPO
    SME IPO
    Current SME IPO
    Upcoming SME IPO
    Recently Closed SME IPO
    Live IPOs
    Fujiyama Power Systems IPO
    Tenneco Clean Air India IPO
    View All
    Upcoming IPOs
    Capillary Technologies India IPO
    Excelsoft Technologies IPO
    View All
    Mainboard IPO
    SME IPO
    Live IPOs
    Upcoming IPOs
    Current IPO
    Upcoming IPO
    Recently Closed IPO
    Recently Listed IPO
    Current SME IPO
    Upcoming SME IPO
    Recently Closed SME IPO
    Fujiyama Power Systems IPO
    Tenneco Clean Air India IPO
    Capillary Technologies India IPO
    Excelsoft Technologies IPO

Here's Your Guide To Trading With The Ichimoku Cloud Indicator

  •  4m
  •  1,798
  • Updated 21 Apr 2023

Ichimoku Cloud is a widely used indicator, built by Japanese journalist Goichi Hosoda, and published in the late 1960s. This indicator uses moving averages to identify support and resistance levels. Moreover, it also throws light on price momentum and trend direction. With all these combinations, the indicator has acquired a 'cloud' methodology to identify reversal, support, and resistance levels while also facilitating the prediction of future directions.

The Ichimoku Cloud comprises five lines among which two demonstrate a cloud. These include Conversion line, Base line (confirmation line), lagging line, and the cloud (includes two lines -- 'Span A' and 'Span B').

These combinations include a 9-day average, 26-day average, an average of those two averages, a 52-day average, and the closing price line. The significance is given highly to the signal established by the cloud. The price trading above the cloud shows a positive trend and when the price trades below the cloud, it signifies a downward trend.

The change in colour, sometimes exhibits a shift in trend as well as sentiment.

As the cloud's size expands, one can assume consolidation or price witnessing buying momentum during the corrective moves. On a bigger scale, the price tends to move in a single direction.

When the cloud starts to move in accordance to the price, the trend is dubbed to be highly firm. The underlying momentum and sentiment is highly optimistic.

It is highly inappropriate to trade when the price is within the cloud. This may result in high volatility and wild swings.

When the base line makes a positive crossover with the conversion line, the trend is recognized as bullish. Conversely, a negative crossover depicts the bias towards the negative trend.

If the lagging line is trending upward; the negative signals of base and conversion lines are avoided. Herein, the lagging line trading above the price reflects an upward trend and vice-versa.

According to the cloud theory, when the base line makes a positive crossover with the conversion line, the cloud needs to be below the price for it to be a strong buy signal. If the cloud is below the price, the trend is recognised as a weak buy signal. Similarly, in a negative crossover of the base line, the cloud needs to be above the price to affirm a strong negative signal.

Ichimuko Cloud provides excellent signals when the market is trending. Sideways movement often exhibits lagging signs.
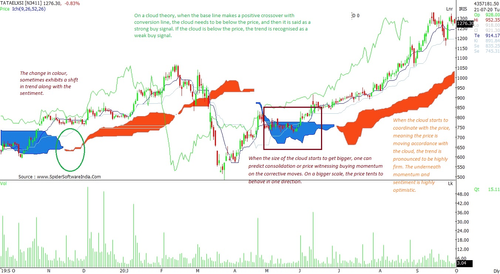
As mentioned above, the cloud is made up of two lines: Span A and Span B. The upper line is 'span A' and the bottom line is 'span B'. When the price crosses the cloud upward, thus conquering span A line with price trading above the cloud, the trend is said to be highly bullish.

On the other hand, when it breaches the cloud downward, breaking Span B line with the price staying below the cloud, the trend reflects highly bearish sentiment.

Likewise, during the positive cloud crossover, if the price is below the cloud, the trend is said to be mildly bullish. Similarly, a negative cloud crossover with price placed above the cloud suggests a weak negative sentiment.

Did you enjoy this article?

0 people liked this article.

What could we have done to make this article better?

Read Full Article >
Open Your Demat Account Now!
+91 -

Open Your Demat Account Now!
+91 -