• Products
    Investment Suite
    Stocks
    Mutual Funds
    Future and Options
    IPO
    Exchange Traded Funds
    Commodity
    Stockcase (Stock Baskets)
    Non Convertible Debentures
    Sovereign Gold Bond
    Exclusive
    NRI Account
    Corporate/HUF Trading Account
    Private Client Group
    Features
    SipIt
    MTF
    Investment Suite
    Exclusive
    Features
    Stocks
    Mutual Funds
    Future and Options
    IPO
    Exchange Traded Funds
    Commodity
    Stockcase (Stock Baskets)
    Non Convertible Debentures
    Sovereign Gold Bond
    NRI Account
    Corporate/HUF Trading Account
    Private Client Group
    SipIt
    MTF
  • Platform
    Trading Platforms
    Kotak Neo App & Web
    Nest Trading Terminal
    NEO Trade APIs
    Trade From Charts
    Features and Tools
    MTF
    Securities Accepted as Collateral
    Margin Requirements
    Equity Screeners
    Payoff Analyzer
    Calculators
    SIP Calculator
    Lumpsum Calculator
    Brokerage Calculator
    Margin Calculator
    MTF Calculator
    SWP Calculator
    CAGR Calculator
    Simple Interest Calculator
    ELSS Calculator
    Step up SIP Calculator
    All Calculators
    Trading Platforms
    Features and Tools
    Calculators
    Kotak Neo App & Web
    Nest Trading Terminal
    NEO Trade APIs
    Trade From Charts
    MTF
    Securities Accepted as Collateral
    Margin Requirements
    Equity Screeners
    Payoff Analyzer
    SIP Calculator
    Lumpsum Calculator
    Brokerage Calculator
    Margin Calculator
    MTF Calculator
    SWP Calculator
    CAGR Calculator
    Simple Interest Calculator
    ELSS Calculator
    Step up SIP Calculator
  • Pricing
  • Research
    Research Calls
    Long Term calls
    Short Term calls
    Intraday calls
    Derivatives calls
    Pick of the week
    Top Monthly Picks
    Stock Research Recommendations
    MTF Stock Recommendations
    Research Reports
    Fundamental Research Report
    Technical Research Report
    Derivative Research Report
    Research Calls
    Research Reports
    Long Term calls
    Short Term calls
    Intraday calls
    Derivatives calls
    Pick of the week
    Top Monthly Picks
    Stock Research Recommendations
    MTF Stock Recommendations
    Fundamental Research Report
    Technical Research Report
    Derivative Research Report
  • Market
    Market Movers
    Share Market Today
    Top Gainers
    Top Losers
    Stocks
    Large Cap
    Mid Cap
    Small Cap
    Indices
    Nifty 50
    Bank Nifty
    FinNifty
    Nifty Midcap India
    VIX
    All Indices
    Mutual Funds
    SBI Mutual Funds
    HDFC Mutual Funds
    Axis Mutual Funds
    ICICI Prudential Mutual Funds
    Nippon India Mutual Funds
    All AMC's
    IPO
    Upcoming IPO
    Current IPO
    Closed IPO
    Recently Listed IPO
    Tata Capital IPO
    Amanta Healthcare IPO
    Quarterly Results
    Jindal Steel's Q1 FY 2025-26 Quarterly Results
    SRI LOTUS DEVLPRS N RTY L's Q1 FY 2025-26 Quarterly Results
    Aeroflex Neu's Q1 FY 2025-26 Quarterly Results
    PVP Ventures' Q1 FY 2025-26 Quarterly Results
    Market Movers
    Stocks
    Indices
    Mutual Funds
    IPO
    Quarterly Results
    Share Market Today
    Top Gainers
    Top Losers
    52 Week High
    52 Week Low
    Volume Shockers
    Large Cap
    Mid Cap
    Small Cap
    State Bank of India
    Reliance Industries Ltd
    HDFC Bank Ltd
    Infosys Ltd
    Tata Consultancy Services Ltd
    Hindustan Unilever Ltd
    ITC Ltd
    IRCTC
    NSE
    Nifty 50
    Bank Nifty
    FinNifty
    Nifty Midcap India
    VIX
    BSE
    Sensex
    BSE Bankex
    BSE Small Cap
    BSE Mid Cap
    BSE 100
    Indian Indices
    Global Indices
    Gift Nifty
    S&P
    Nikkei Index
    Hong Kong Index
    KOSPI Index
    Global Indices
    AMC's
    SBI Mutual Funds
    HDFC Mutual Funds
    Axis Mutual Funds
    ICICI Prudential Mutual Funds
    Nippon India Mutual Funds
    Schemes
    Parag Parikh Flexi Cap
    SBI Small Cap Fund
    SBI Contra Fund
    Nippon Small Cap Fund
    ICICI Pru Technology Fund
    Upcoming IPO
    Current IPO
    Closed IPO
    Recently Listed IPO
    Tata Capital IPO
    Amanta Healthcare IPO
    Sugs Lloyd Ltd
    Snehaa Organics Ltd
    Abril Paper Tech Ltd
    Rachit Prints Ltd
    Amanta Healthcare Ltd
    Optivalue Tek Consulting Ltd
    Goel Construction Company Ltd
    boAt IPO
    Jindal Steel's Q1 FY 2025-26 Quarterly Results
    SRI LOTUS DEVLPRS N RTY L's Q1 FY 2025-26 Quarterly Results
    Aeroflex Neu's Q1 FY 2025-26 Quarterly Results
    PVP Ventures' Q1 FY 2025-26 Quarterly Results
    NDR INVIT Trust's Q1 FY 2025-26 Quarterly Results
    Jaiprakash Associates' Q1 FY 2025-26 Quarterly Results
    Alps Industries' Q1 FY 2025-26 Quarterly Results
    Brightcom Group's Q1 FY 2025-26 Quarterly Results
    Visa Steel's Q1 FY 2025-26 Quarterly Results
    Coffee Day Enterprises' Q1 FY 2025-26 Quarterly Results
    Supreme Holdings & Hospitality's Q1 FY 2025-26 Quarterly Results
    Kavveri Defence & Wireless Technologies' Q1 FY 2025-26 Quarterly Results
  • Learn
    Stockshaala
    Basics of Stock Market
    Introduction to Fundamental Analysis
    Introduction to Technical Analysis
    Derivatives, Risk management & Option Trading Strategies
    Personal Finance
    Resource
    Market Ready
    Kotak Insights
    Infographic
    Podcast
    Webinars
    Youtube Channel
    Investing Guide
    Demat Account
    Trading Account
    Share Market
    Intraday Trading
    IPO
    Mutual Funds
    Events
    Budget 2025
    Muhurat Trading
    Share Market Holiday
    Market Outlook 2025
    Stockshaala
    Resource
    Investing Guide
    Events
    Basics of Stock Market
    Introduction to Fundamental Analysis
    Introduction to Technical Analysis
    Derivatives, Risk management & Option Trading Strategies
    Personal Finance
    Market Ready
    Kotak Insights
    Infographic
    Podcast
    Webinars
    Youtube Channel
    Demat Account
    Trading Account
    Share Market
    Intraday Trading
    IPO
    Mutual Funds
    Budget 2025
    Muhurat Trading
    Share Market Holiday
    Market Outlook 2025
  • Partner
    Business Associates
    Kotak Connect Plus
    Startup connect
    Business Associates
    Kotak Connect Plus
    Startup connect
  • Support
    FAQs
    Circulars
    Bulletins
    Contact Us
    Forms Download
    Get your Statement
    FAQs
    Circulars
    Bulletins
    Contact Us
    Forms Download
    Get your Statement
  • News

Here's How To Read And Use The Standard Deviation Indicator In Tradings

  •  3m
  •  4,722
  • Updated 20 Apr 2023

Standard Deviation measures the volatility of securities. It is computed as the square root of variance with respect to the mean price. In simple language, it helps one identify the spread or deviation of a price from the mean by considering the historical price data. Higher Standard Deviation means the price has deviated considerably from the mean price, while lower deviation signifies minor variation from the mean.

Generally, blue-chip / large-cap stocks have a lower Standard Deviation compared to illiquid or small-cap stocks. When it comes to choosing a risky investment, market participants opt for stocks with higher standard deviation that provides volatility, which can be used for quick profits. As such, deviation is a key aspect of fundamental analysis, which determines risks involved in various stocks, funds, and other assists.

  • Standard Deviation can assist in determining the target price of a security.

  • Standard Deviation does not identify the trend or direction, but reveals the price movement based on the historical data.

  • Sometimes, Standard Deviation may provide misleading information, due to unexpected developments regarding the company.

  • It helps to allocate portfolios based on the volatility of stocks. Likewise, it assists in establishing a risk trade with higher returns on the higher standard deviation.

  • When a Standard Deviation starts showing exponential rise, one can assume the existence of higher volatility.

  • Standard Deviation in coordination with other indicators is more useful than focusing on it as the sole indicator.

  • Standard Deviation is unlikely to contribute majorly in intra-day strategies or day trading sessions. Nevertheless, a generalist view may provide minor inputs.

Standard Deviation does not deliver any trend signals. Rather, it is an instrument that measures and understands volatility and deviations. With a close look at the charts, one can easily identify the shift in volatility as the line alters its direction. A gradual change in the Standard Deviation line indicates the on-going and expected volatility for the next few sessions. (Nifty 50 charts)

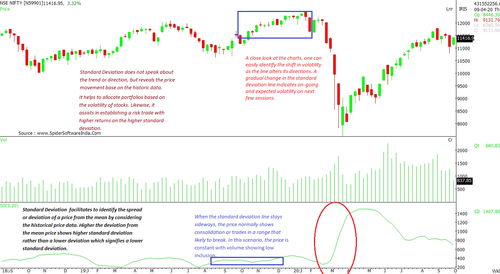
When the standard deviation line stays sideways, the price normally shows consolidation or trades in a range that is likely to break. In this scenario, the price is constant with volume showing low participation.

Likewise, when the Standard Deviation on charts shows a gradual rise for several sessions, it is likely to witness higher volatility.

When combined with other momentum indicators like Moving Average Convergence Divergence (MACD) Relative Strength Index (RSI) or price indicators like Bollinger band, moving averages, candlestick pattern, chart pattern, the standard deviation has shown a strong relationship with the Bollinger Band and chart patterns. One can pre-empt the price move to conquer the upper band of Bollinger having strong volatility with standard deviation.

Similarly, if the breakout on chart patterns witnesses sideways trend on standard deviation, the breakout or breakdown is likely to see normal volatility. Whereas, a higher standard deviation in the formation of any chart patterns signals even more volatility on trend confirmation of the breakout.

Did you enjoy this article?

0 people liked this article.

What could we have done to make this article better?

Read Full Article >
Open Your Demat Account Now!
+91 -

Open Your Demat Account Now!
+91 -