• Products
    Investment Suite
    Stocks
    Mutual Funds
    Future and Options
    IPO
    Exchange Traded Funds
    Commodity
    Stockcase (Stock Baskets)
    Non Convertible Debentures
    Sovereign Gold Bond
    Exclusive
    NRI Account
    Corporate/HUF Trading Account
    Private Client Group
    Features
    SipIt
    MTF
    Investment Suite
    Exclusive
    Features
    Stocks
    Mutual Funds
    Future and Options
    IPO
    Exchange Traded Funds
    Commodity
    Stockcase (Stock Baskets)
    Non Convertible Debentures
    Sovereign Gold Bond
    NRI Account
    Corporate/HUF Trading Account
    Private Client Group
    SipIt
    MTF
  • Platform
    Trading Platforms
    Kotak Neo App & Web
    Nest Trading Terminal
    NEO Trade APIs
    Trade From Charts
    Features and Tools
    MTF
    Securities Accepted as Collateral
    Margin Requirements
    Equity Screeners
    Payoff Analyzer
    Calculators
    SIP Calculator
    Lumpsum Calculator
    Brokerage Calculator
    Margin Calculator
    MTF Calculator
    SWP Calculator
    CAGR Calculator
    Simple Interest Calculator
    ELSS Calculator
    Step up SIP Calculator
    All Calculators
    Trading Platforms
    Features and Tools
    Calculators
    Kotak Neo App & Web
    Nest Trading Terminal
    NEO Trade APIs
    Trade From Charts
    MTF
    Securities Accepted as Collateral
    Margin Requirements
    Equity Screeners
    Payoff Analyzer
    SIP Calculator
    Lumpsum Calculator
    Brokerage Calculator
    Margin Calculator
    MTF Calculator
    SWP Calculator
    CAGR Calculator
    Simple Interest Calculator
    ELSS Calculator
    Step up SIP Calculator
  • Pricing
  • Research
    Research Calls
    Long Term calls
    Short Term calls
    Intraday calls
    Derivatives calls
    Pick of the week
    Top Monthly Picks
    Stock Research Recommendations
    MTF Stock Recommendations
    Research Reports
    Fundamental Research Report
    Technical Research Report
    Derivative Research Report
    Research Calls
    Research Reports
    Long Term calls
    Short Term calls
    Intraday calls
    Derivatives calls
    Pick of the week
    Top Monthly Picks
    Stock Research Recommendations
    MTF Stock Recommendations
    Fundamental Research Report
    Technical Research Report
    Derivative Research Report
  • Market
    Market Movers
    Share Market Today
    Top Gainers
    Top Losers
    Stocks
    Large Cap
    Mid Cap
    Small Cap
    Indices
    Nifty 50
    Bank Nifty
    FinNifty
    Nifty Midcap India
    VIX
    All Indices
    Mutual Funds
    SBI Mutual Funds
    HDFC Mutual Funds
    Axis Mutual Funds
    ICICI Prudential Mutual Funds
    Nippon India Mutual Funds
    All AMC's
    IPO
    Upcoming IPO
    Current IPO
    IPO Allotment Status
    IPO Subscription Status
    Closed IPO
    Recently Listed IPO
    Quarterly Results
    Vertis Infrastructure Trust's Q1 FY 2025-26 Quarterly Results
    Highways Infrastructure Trust's Q1 FY 2025-26 Quarterly Results
    Handson Global Management (HGM)'s Q1 FY 2025-26 Quarterly Results
    Swan Corp's Q1 FY 2025-26 Quarterly Results
    Market Movers
    Stocks
    Indices
    Mutual Funds
    IPO
    Quarterly Results
    Share Market Today
    Top Gainers
    Top Losers
    52 Week High
    52 Week Low
    Volume Shockers
    Large Cap
    Mid Cap
    Small Cap
    State Bank of India
    Reliance Industries Ltd
    HDFC Bank Ltd
    Infosys Ltd
    Tata Consultancy Services Ltd
    Hindustan Unilever Ltd
    ITC Ltd
    IRCTC
    NSE
    Nifty 50
    Bank Nifty
    FinNifty
    Nifty Midcap India
    VIX
    BSE
    Sensex
    BSE Bankex
    BSE Small Cap
    BSE Mid Cap
    BSE 100
    Indian Indices
    Global Indices
    Gift Nifty
    S&P
    Nikkei Index
    Hong Kong Index
    KOSPI Index
    Global Indices
    AMC's
    SBI Mutual Funds
    HDFC Mutual Funds
    Axis Mutual Funds
    ICICI Prudential Mutual Funds
    Nippon India Mutual Funds
    Schemes
    Parag Parikh Flexi Cap
    SBI Small Cap Fund
    SBI Contra Fund
    Nippon Small Cap Fund
    ICICI Pru Technology Fund
    Upcoming IPO
    Current IPO
    IPO Allotment Status
    IPO Subscription Status
    Closed IPO
    Recently Listed IPO
    Taurian MPS IPO
    Karbonsteel Engineering IPO
    Nilachal Carbo Metalicks IPO
    Krupalu Metals IPO
    Shringar House of Mangalsutra IPO
    Galaxy Medicare IPO
    Urban Company IPO
    Jay Ambe Supermarkets IPO
    Vertis Infrastructure Trust's Q1 FY 2025-26 Quarterly Results
    Highways Infrastructure Trust's Q1 FY 2025-26 Quarterly Results
    Handson Global Management (HGM)'s Q1 FY 2025-26 Quarterly Results
    Swan Corp's Q1 FY 2025-26 Quarterly Results
    Borosil Renewables' Q1 FY 2025-26 Quarterly Results
    Jindal Steel's Q1 FY 2025-26 Quarterly Results
    SRI LOTUS DEVLPRS N RTY L's Q1 FY 2025-26 Quarterly Results
    Aeroflex Neu's Q1 FY 2025-26 Quarterly Results
    PVP Ventures' Q1 FY 2025-26 Quarterly Results
    NDR INVIT Trust's Q1 FY 2025-26 Quarterly Results
    Jaiprakash Associates' Q1 FY 2025-26 Quarterly Results
    Alps Industries' Q1 FY 2025-26 Quarterly Results
  • Learn
    Stockshaala
    Basics of Stock Market
    Introduction to Fundamental Analysis
    Introduction to Technical Analysis
    Derivatives, Risk management & Option Trading Strategies
    Personal Finance
    Resource
    Market Ready
    Kotak Insights
    Infographic
    Podcast
    Webinars
    Youtube Channel
    Investing Guide
    Demat Account
    Trading Account
    Share Market
    Intraday Trading
    IPO
    Mutual Funds
    Events
    Budget 2025
    Muhurat Trading
    Share Market Holiday
    Market Outlook 2025
    Stockshaala
    Resource
    Investing Guide
    Events
    Basics of Stock Market
    Introduction to Fundamental Analysis
    Introduction to Technical Analysis
    Derivatives, Risk management & Option Trading Strategies
    Personal Finance
    Market Ready
    Kotak Insights
    Infographic
    Podcast
    Webinars
    Youtube Channel
    Demat Account
    Trading Account
    Share Market
    Intraday Trading
    IPO
    Mutual Funds
    Budget 2025
    Muhurat Trading
    Share Market Holiday
    Market Outlook 2025
  • Partner
    Business Associates
    Kotak Connect Plus
    Startup connect
    Business Associates
    Kotak Connect Plus
    Startup connect
  • Support
    FAQs
    Circulars
    Bulletins
    Contact Us
    Forms Download
    Get your Statement
    FAQs
    Circulars
    Bulletins
    Contact Us
    Forms Download
    Get your Statement
  • News

All You Wanted To Know About Support And Resistance Levels

  •  4m
  •  1,617
  • Updated 21 Apr 2023

Support and resistance are two points that indicate positive and negative reversals, respectively, in trading. Support shows the level where traders or investors are ready to buy, causing the buying momentum to emerge while selling pressure diminishes. In resistance, the buying strength starts to peter out, exhibiting buyers' exhaustion at that level and sellers' entry into the market.

  • The first sign of a change in trend can be identified by support and resistance levels.

  • The strength of a counter depends on the ability to hold support levels and cross resistance range.

  • The strategies of support or resistance levels may vary for each stock. The same technical tool may not hold true for every counter.

  • Deep study of support and resistance helps in early entry or timely exit.

  • For a short-term trade, small moving averages can be employed. However, from a medium-term perspective, a larger moving average needs to be taken into consideration.

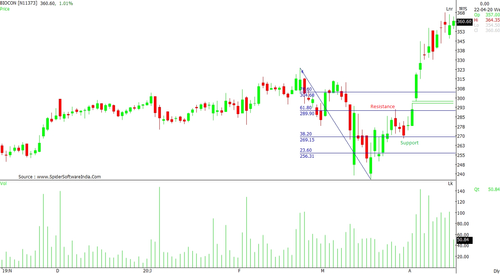
  • Fibonacci Retracement:

Fibonacci ratio highlights support and resistance levels based on the extent of retracement in terms of percentage. The phenomenon caters to the likely percentage retracement of a strong rise that may see an addition in volumes. The Fibonacci retracement levels are 23.6 per cent, 38.2 per cent, 61.8 per cent, and 78.6 per cent.
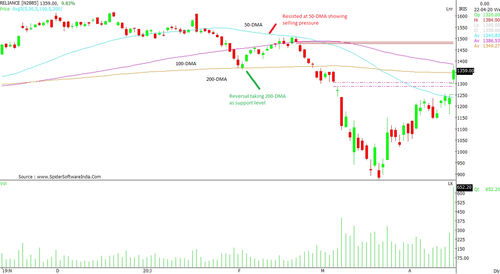
  • Moving Averages:

Simple moving average is an average of price for a certain period of time that helps determine support and resistance levels. The major moving averages are 50-day moving average (DMA), 100-DMA, and 200-DMA. Whenever the counter is hesitant towards climbing further, it may correct towards one of the moving average levels. These averages say that buyers should regain upside on the average traded price of the specified days.
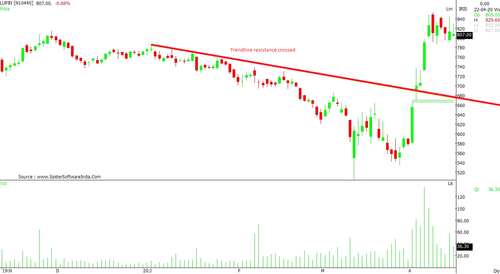
  • Trendlines:

Trendline is plotted considering the points where the counter witnessed buying reversals in the past. Two or more points are selected to draw a line that shows trendline support. This line may be sliding or horizontal, depending on the reversal points. (Lupin chart)

  • Other Indicators:

Gap up / Gap down combined with volume also help identify short-term bottom or top. These levels become support or resistance for few forthcoming sessions. Technical indicators like Relative Strength Index (RSI) and Moving Average Convergence Divergence (MACD) also help in understanding the strength levels.

Unless supports or resistances are broken, the trend may not develop into a strong rally. When resistance is crossed on the higher side, the next leg of upside may emerge, triggering volume-supported buying. Similarly, when a major support gets breached, the selling pressure provides greater opportunity to “short sell” traders.

If the price holds the support level and shows a reversal with positive formation on charts or technical indicators, then medium-term perspective becomes stronger. Such technical formations alter the medium-term perspective, resulting in an overall trend becoming positive which favors intraday or very short-term trades.

Did you enjoy this article?

0 people liked this article.

What could we have done to make this article better?

Read Full Article >
Open Your Demat Account Now!
+91 -

Open Your Demat Account Now!
+91 -